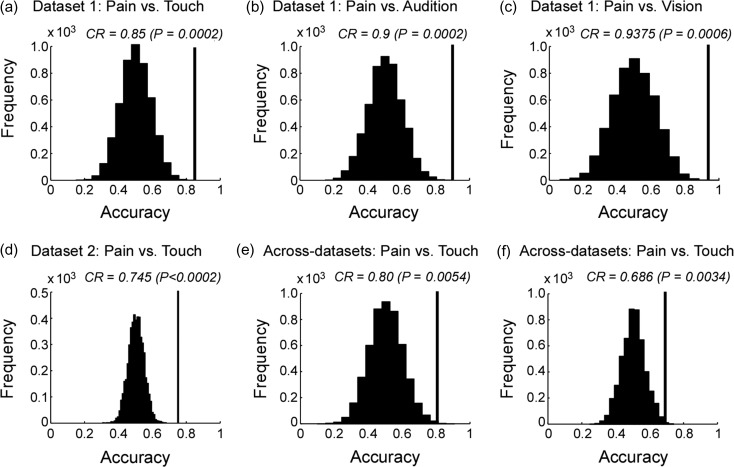
Figure 4.
Within-dataset (a–d) and across-datasets (e, f) classification accuracies of “pain vs. non-pain” classifications obtained from normalized data, along with the corresponding null distributions. Panels a–c: results obtained from Dataset 1 for the three classifications, respectively. Panel d: result obtained from Dataset 2 for the “pain vs. touch” classification. Panel e: result obtained using Dataset 2 as training dataset and Dataset 1 as test dataset. Panel f: result obtained using Dataset 1 as training dataset and Dataset 2 as test dataset. Classification accuracies (correct rate, CR) are indicated by black vertical lines and corresponding null distributions (obtained from 5 000 permutations) are indicated by black bell shapes centered around chance level accuracy of 0.5. P-values were calculated as the proportion of how many (out of 5 000) permutations generated accuracy greater than or equal to the actual classification accuracy. If none out of 5 000 permutations reached the actual accuracy, the P-value is labeled as P < 0.0002 (i.e., <1/5 000).

