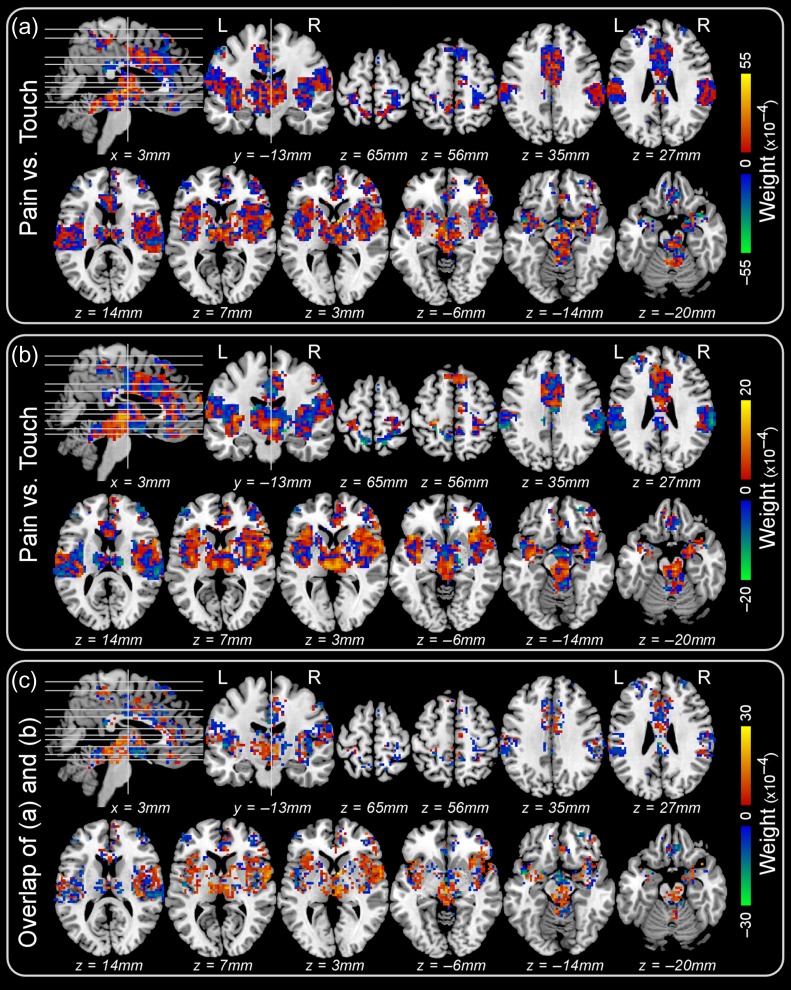
Figure 6.
Sensitivity maps obtained from the “pain vs. touch” classification across-datasets. Panel a: sensitivity map obtained when the classifier was trained using Dataset 2 and tested on Dataset 1. Panel b: sensitivity map obtained when the classifier was trained using Dataset 1 and tested on Dataset 2. Panel c: overlap (i.e., the voxels of which the weights have consistent sign) between the two sensitivity maps (a) and (b).

