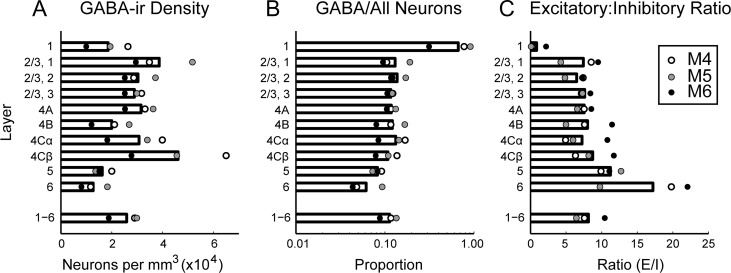
Figure 3.
Absolute and relative density of GABA-ir neurons in each cortical layer. (A): Density per mm3 of GABA-ir neurons computed within laminar boundaries specified separately for each image series. Bars show mean across animals; average laminar densities from each animal are plotted as points. (B): Proportion of all neurons in each layer (García-Marín et al. 2017) that were GABA-ir. (C): Ratio of non-GABA-ir to GABA-ir neurons in each layer. Density of non-GABA-ir neurons was computed by subtracting the GABA-ir neuronal density measured in this study from the total neuronal density, which was estimated by multiplying the total DAPI-labeled cell density by the ratio of neurons to all cells in each layer reported previously (García-Marín et al. 2017).

