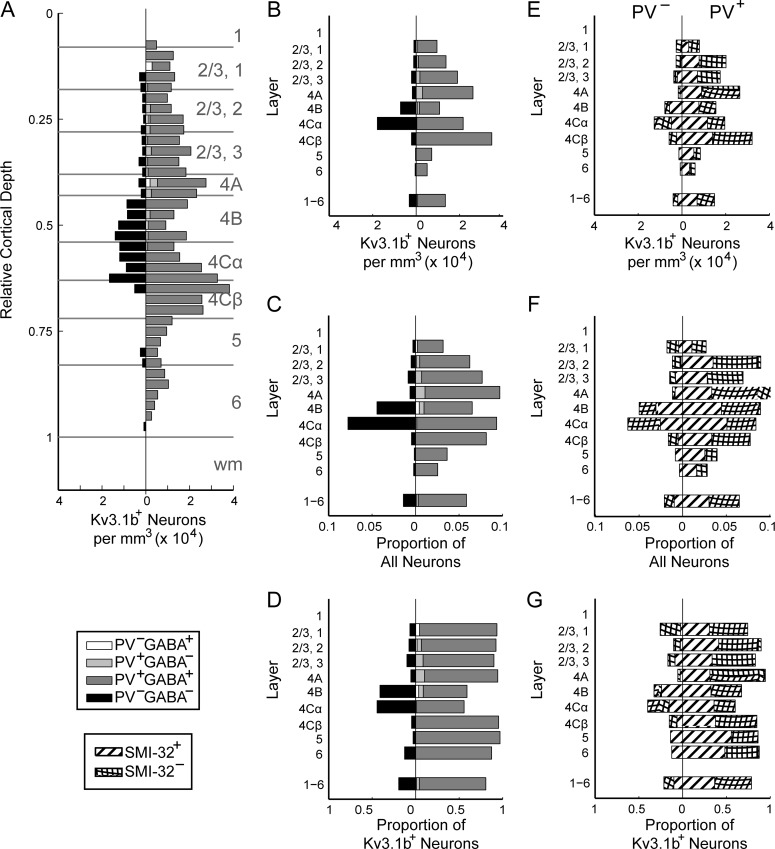
Figure 6.
Density distributions of Kv3.1b-ir neurons by coimmunoreactivity. Data from animals M4-M6. (A): Density per mm3 of Kv3.1b-ir, non-GABA-ir, non-PV-ir neurons (black; left of vertical); Kv3.1b-ir, GABA-ir, non-PV-ir (white; right of vertical); Kv3.1b-ir, PV-ir, non-GABA-ir (light gray; right of vertical); and Kv3.1b-ir, GABA-ir, and PV-ir (dark gray; right of vertical) as a function of relative cortical depth. (B): Densities of neurons of each type (types as in A) in each cortical layer. (C): Frequency of neurons by type (types as in A) relative to the total neuronal population in that layer (García-Marín et al. 2017). (D): Frequency of neurons by type (types as in A) relative to the total Kv3.1b-ir neuronal population in that layer. (E): Densities of Kv3.1b-ir neurons that were (right) and were not (left) also ir for PV in each cortical layer. Bars filled with striped pattern represent neurons that were also SMI-32-ir, while bars filled with hatched pattern represent neurons that were not SMI-32-ir. (F): Proportion of total neuronal population in each layer accounted for by each type of neuron (types as in E). (G): Frequency of each type of Kv3.1b-ir neuron (as in E) relative to total Kv3.1b-ir population.

