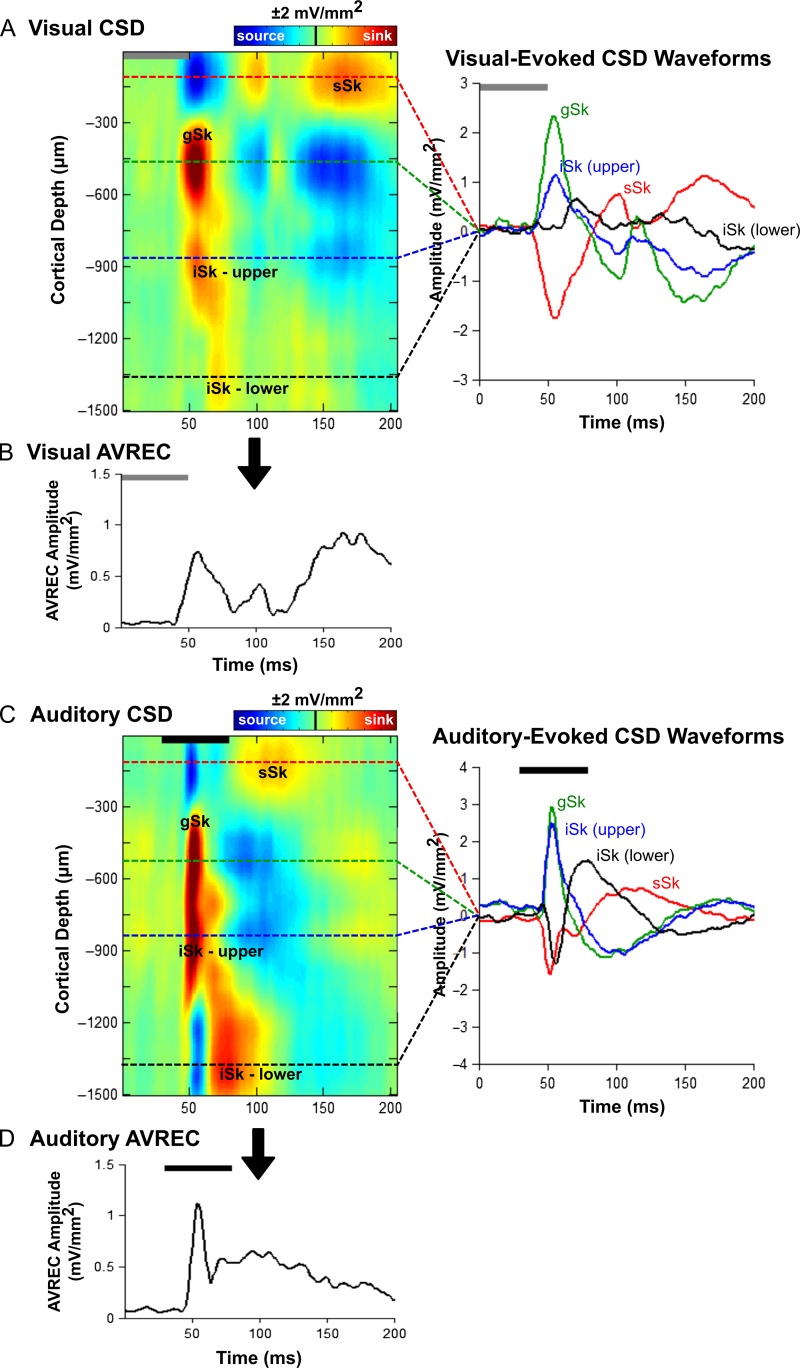
Figure 2.
Visual- and auditory-evoked current source density (CSD) profiles within the multisensory zone of the lateral extrastriate visual cortex (V2L-Mz). (A) Representative CSD profile (left) and extracted CSD waveforms (right) from a control rat in response to a visual stimulus (50 ms LED flash at 15 lux, denoted by the grey bar). Prominent current sinks (red) are reflective of a depolarization of neurons in the surrounding cortical region, whereas prominent current sources (blue) reflect a repolarization of neurons in the surrounding cortical regions. As shown in the CSD waveforms, the supragranular (sSk, red), granular (gSk, green), infragranular-upper (iSk upper, blue) and infragranular-lower (iSk lower, black) responses (sinks are positive, sources are negative) were extracted from the electrode showing the highest amplitude for each of the individual sinks (denoted by the dashed lines on the CSD images). (B) Average rectified current source density (AVREC) analysis derived from the CSD profiles in (A) in response to a visual stimulus. (C) Representative CSD profile (left) and extracted CSD waveforms (right) from a control rat in response to an auditory stimulus (50 ms noise burst at 40 dB above click threshold, denoted by the black bar). (D) Average rectified current source density (AVREC) analysis derived from the CSD profiles in (C) in response to an auditory stimulus.

