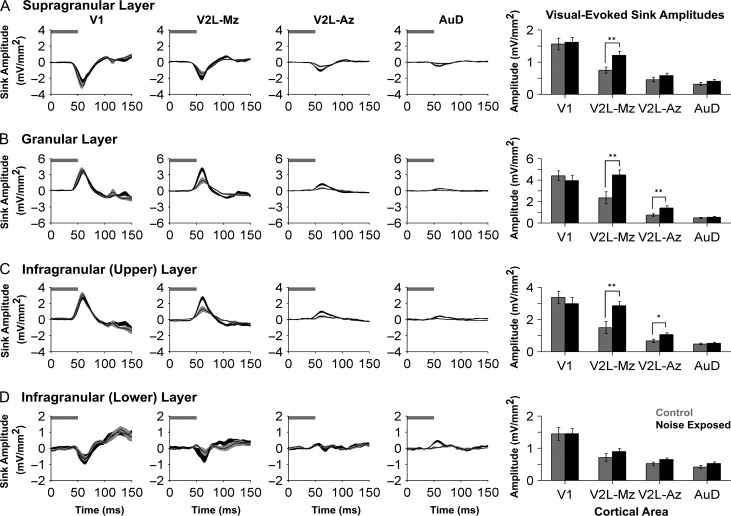
Figure 4.
Increased visual responsiveness occurred across the cortical layers within higher order sensory regions. Averaged CSD waveforms from supragranular (A), granular (B), infragranular-upper (C), and infragranular-lower (D) layers within all recordings locations (i.e., V1, V2L-Mz, V2L-Az, and AuD; from left to right). Horizontal grey bar denotes the visual stimulus and the dark lines represent the group mean and shading represents the SEM for the noise exposed (dark grey; n = 9) and control (light grey; n = 8) groups. Note that in order to display the changes that occurred within each of the cortical layers, each y-ordinate is specific to the waveform profile for that layer. An analysis of sink amplitudes within each cortical layer (see bar graphs on the far right) shows a significant increase in visual responsiveness with the multisensory zone of V2L (V2L-Mz) across most cortical layers. This evidence of hearing loss-induced crossmodal plasticity was also present in the granular (P < 0.01) and the infragranular-upper layer (P < 0.01) of the auditory zone of V2L (V2L-Az). Values are mean ± SEM for the noise exposed (n = 9) and control (n = 8) groups. *P < 0.05; **P < 0.013.

