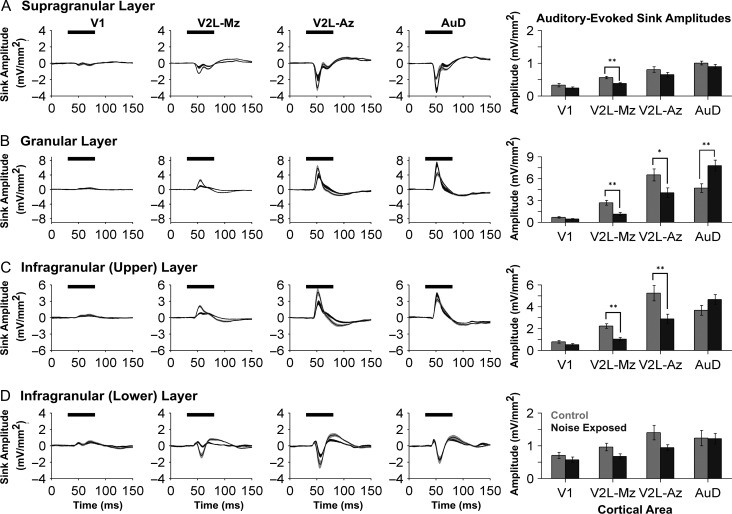
Figure 5.
Noise-induced hearing loss caused region- and layer-specific plasticity in the auditory-evoked CSD profiles across auditory, visual and audiovisual cortices. Averaged CSD waveforms from supragranular (A), granular (B), infragranular-upper (C), and infragranular-lower (D) layers within all recording locations (i.e., V1, V2L-Mz, V2L-Az, and AuD; from left to right). The horizontal black bar denotes the presentation of the auditory stimulus, and the dark lines represent the group mean and shading represents the SEM for the noise exposed (dark grey; n = 9) and control (light grey; n = 8) groups. Consistent with Figure 4, the y-ordinate is specific to the waveform profile for each cortical layer. An analysis of auditory-evoked sink amplitudes (see bar graphs on the far right) shows a decrease in sink amplitude within V2L-Mz and V2L-Az, despite adjusting for individual rat differences in hearing sensitivity. Whereas both subregions of V2L demonstrated crossmodal plasticity (i.e., increased visual responsiveness and a commensurate decrease in auditory), their neighboring cortical region, AuD, showed a significant increase in auditory-evoked sink amplitude (P < 0.01), which was restricted to the granular layer. Values are mean ± SEM for the noise exposed (n = 9) and control (n = 8) groups. *P < 0.05; **P < 0.013.

