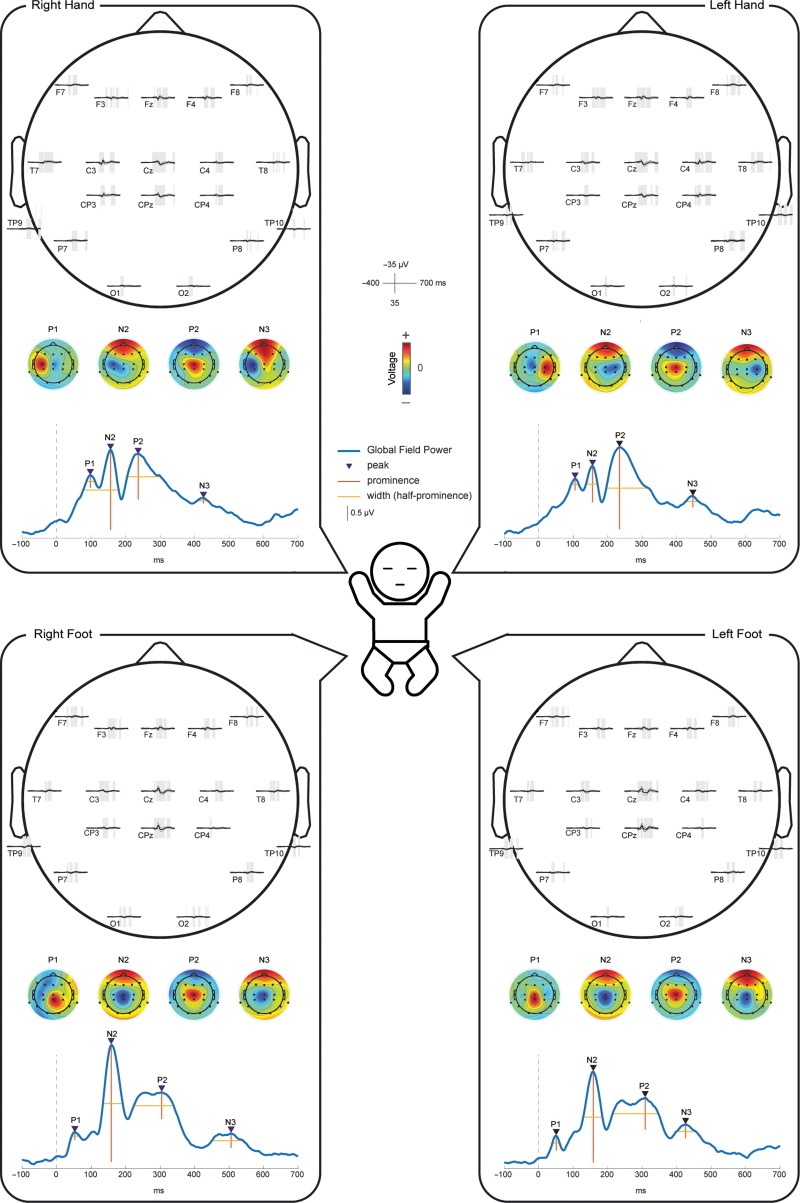
Figure 1.
Grand average of the EEG responses following mechanical stimulation of all 4 limbs. Within each panel we displayed: (i) the grand average of the recordings at each electrode, where shading represent significant deflections (P < 0.05) from baseline; (ii) the global field power (GFP) of the grand average with marked local maxima representing the SEPs; and (iii) topographies of each SEP (normalized by GFP).

