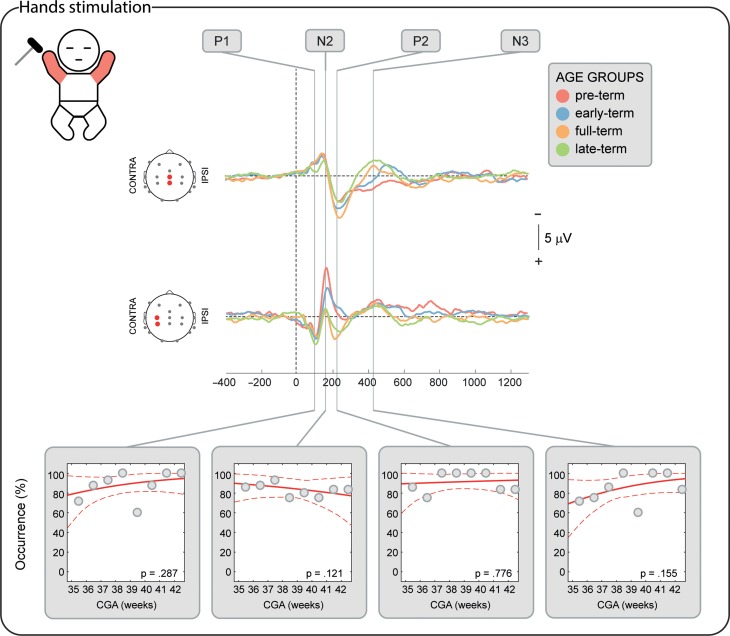
Figure 2.
SEPs occurrence in response to the stimulation of both hands according to corrected gestational age (CGA) at time of study. Upper panel: illustrative mean response recorded at the midline and contralateral pericentral electrodes in 4 age groups (pre-term, early-term, full-term, and late-term) (Table 1). Bottom panels: occurrence of each potential in respect to CGA and significance of the correlation. Gray dots represent mean occurrence in 1-week windows (calculated only for illustrative purposes), the red solid line is the logistic regression curve and the dashed red lines delimit the 95% confidence interval.

