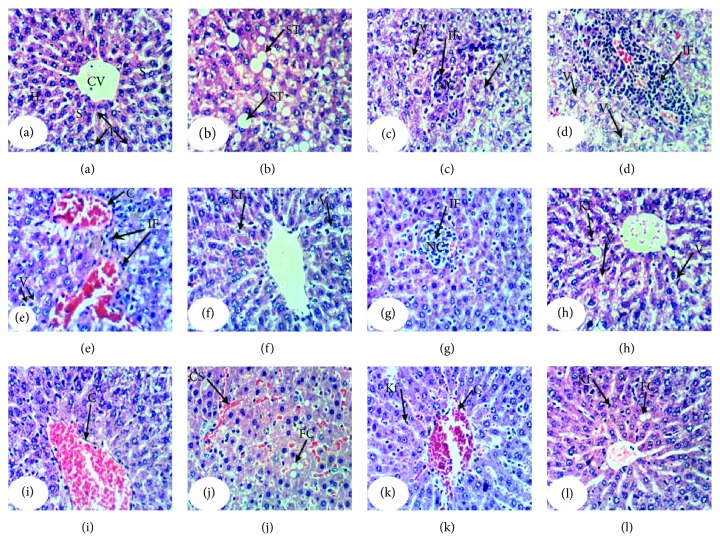
Figure 3.
Photomicrographs of H&E-stained liver sections of normal, APAP-administered rats, and APAP-administered rats treated with the navel orange peel hydroethanolic extract, naringin, and naringenin. (a) Photomicrograph of the liver of normal rat showing a normal structure of liver; normal hepatocytes (H) integrally arranged in the hepatic trabeculae, central vein (CV), and sinusoids (S). (b-e) Photomicrographs of liver sections of APAP-administered rats showing steatosis of hepatocytes (ST) in (b), cytoplasmic vacuolization of hepatocytes (V) and focal hepatic necrosis (NC) associated with mononuclear leucocytic and fibroblastic inflammatory cell infiltration (IF) in (c), portal mononuclear leucocytic inflammatory cell infiltration (IF) in (d), and vascular congestion in (e). (f & g) Photomicrographs of liver sections of APAP-administered rats treated with the navel orange peel hydroethanolic extract showing slight cytoplasmic vacuolization of hepatocytes (V) and Kupffer cell activation (Kf) and mild focal hepatic necrosis (NC) associated with mononuclear leucocytic inflammatory cell infiltration (IF). (h & i) Photomicrographs of liver sections of APAP-administered rats treated with naringin showing severe to mild cytoplasmic vacuolization of hepatocytes (V) and Kupffer cell activation (Kf) in (h) and (i) as well as congestion of the central vein (C) in (h). (j-l) Photomicrographs of liver sections of APAP-administered rats treated with naringenin showing a slight fatty change of hepatocytes (FC) and mild congestion of sinusoids (CS) in (j), Kupffer cell activation (Kf) and moderate congestion of central vein (C) in (k), and slight fatty change of hepatocytes (FC) and Kupffer cell activation (Kf) in (l) (×400).

