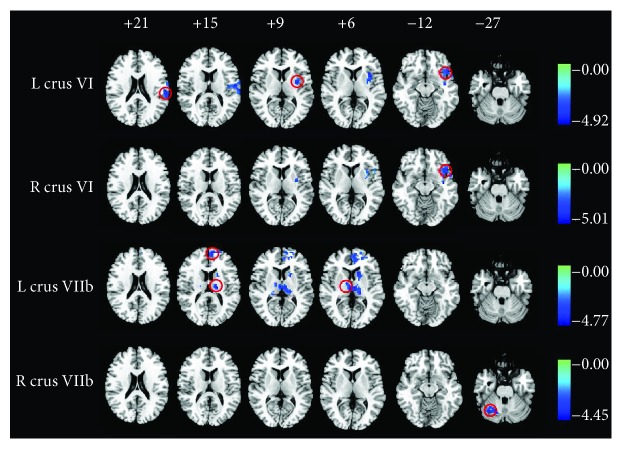
Figure 3.
Whole-brain analysis of functional connectivity (FC) of nine cerebellum subregions. Decreased cerebellar-cerebral FC in SNHL patients compared to healthy controls indicated by colour (p < 0.01, family-wise error corrected). The colour heat map scale at the right shows t values. R: right; L: left.

