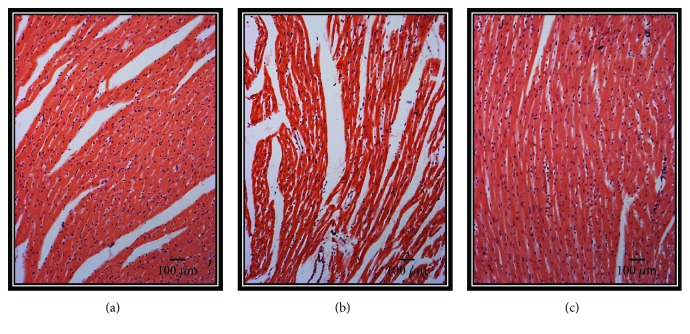
Figure 7.
(a–c) Representative photomicrographs of heart tissue after of reperfusion from the three experimental groups. 5 fields per sample were analyzed. (a) Ctr, (b) MS, and (c) MS + HSL. Values are the mean ± SE (n = 6). The tissue was processed according to conventional histological procedures, and histological sections were made and stained by hematoxylin-eosin stain at 10x. Ctr: control; MS: metabolic syndrome; MS + HSL: metabolic syndrome plus Hibiscus sabdariffa Linnaeus.

