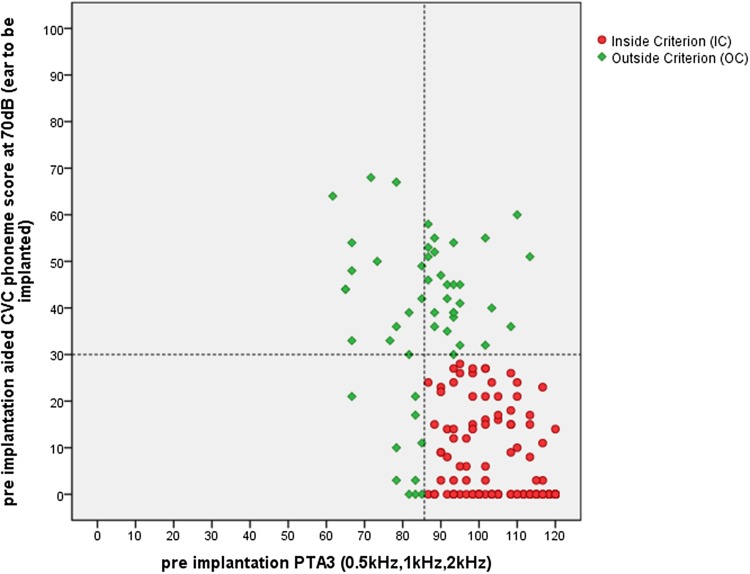
Fig. 1.
The pre-implantation hearing loss levels of 164 CI recipients, presented and classified according to the indication criterion. The horizontal axis shows the pre implantation PTA3 score of the ear to be implanted. The vertical axis shows the aided phoneme scores. Dashed lines indicate the indication boarders

