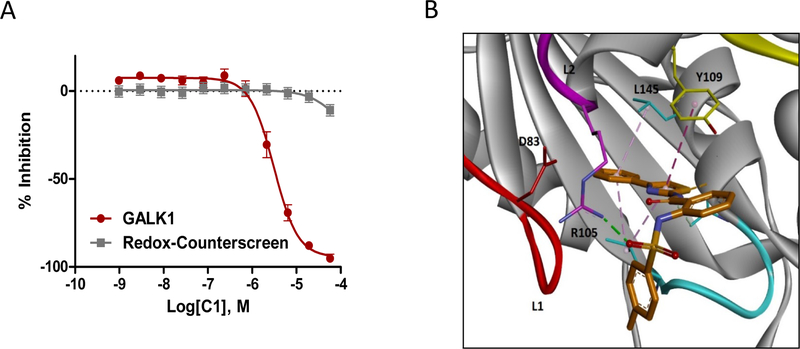
Figure 6.
(A) Dose-response data of C1 in GALK1 inhibition assay and redox cycling counter screen. (B) Predicted binding model of inhibitor C1 at the ATP binding site of GALK1. C1 and key residues are shown in sticks. The binding interactions between inhibitor and residues in the ATP binding site are displayed in dotted line.

