
Table 1.
IC50, maximal response and in vitro ADME properties of C1 and C1 analogs.
| Compounds | Structure | IC50a (μM) |
MR (%) |
Microsomalc T1/2 (m) | Permeabilityd (1e-6 cm/s) | Solubilitye (Ug/ml) |
|---|---|---|---|---|---|---|
| C1 (NCGC00247843) | 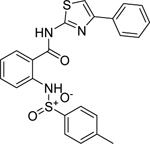 |
3.5 | 100 | 2.5 | 1099.1 | < 1.0 |
| C2 (NCGC00262386) | 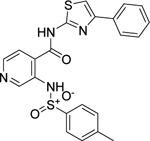 |
14.0 | 83.5 | 17.0 | 724.3 | 9.4 |
| C3 (NCGC00262995) | 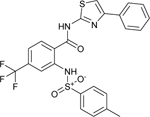 |
15.9 | 92.9 | 15.0 | 82.2 | < 1.0 |
| C4 (NCGC00263701) | 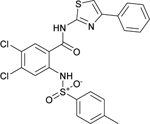 |
22.2 | 89.3 | 13.0 | < 5.0 | <1.0 |
| C5 (NCGC00262417) | 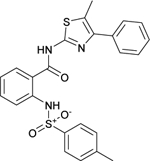 |
11.1 | 75.9 | 6.3 | 30.1 | < 1.0 |
| C6 (NCGC00262418) | 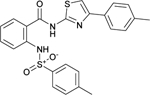 |
14.0 | 81.0 | 2.6 | 35.6 | < 1.0 |
| C7 (NCGC00344941) | 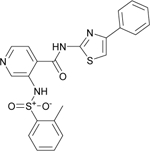 |
11.1 | 90.3 | 14.0 | 1064.7 | 50.0 |
| C8 (NCGC00344944) | 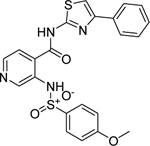 |
15.7 | 84.5 | 1.6 | 674.5 | 54.1 |
| C9 (NCGC00344912) | 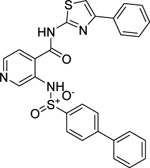 |
17.7 | 88.5 | 2.0 | < 1.0 | < 1.0 |
| C10 (NCGC00345030) | 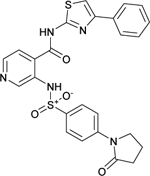 |
44.5 | 62.5 | 1.6 | 313.5 | 57.0 |
a
IC50 values were determined utilizing the luminescence GALK1-ATP-depletion assay.
b
MR represents the maximal % inhibition at 57 μM compound.
c
Rat liver microsome stability.
d
PAMPA permeability assay performed in-house at NCATS.
e
Kinetic aqueous solubility in PBS 7.4 buffer from a 10 mM DMSO compound stock solution.