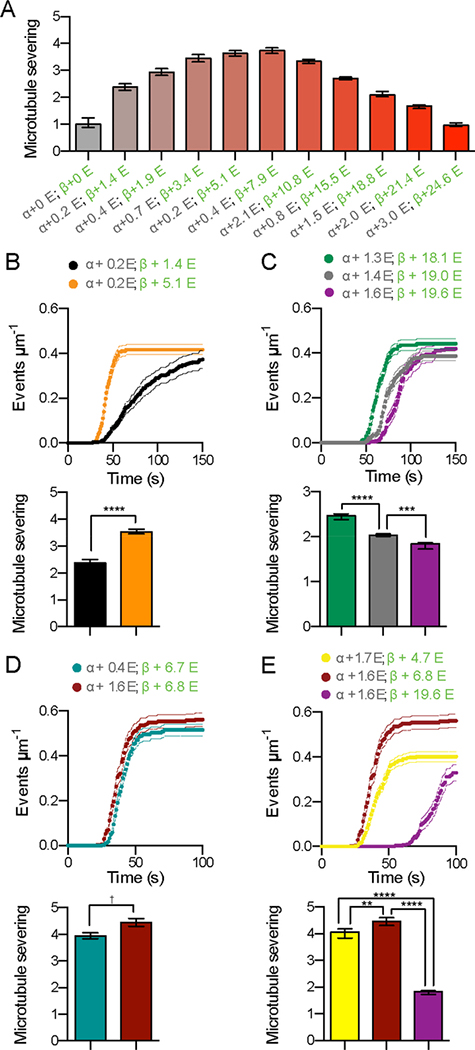
Figure 2. Spastin-catalyzed microtubule severing displays a biphasic response to tubulin glutamylation levels.
(A) Spastin-catalyzed microtubule severing varies with the number of glutamates on tubulin tails. <nE> on α and β-tubulin, indicated in grey and green, respectively. Error bars, S.E.M. (n > 23 microtubules from multiple chambers). Severing rates normalized to that of unmodified microtubules (Experimental Procedures).
(B-C) Modulation of β-tubulin glutamylation levels is sufficient to increase (B) or decrease (C) microtubule severing activity while α-tubulin glutamylation levels are kept constant (for mass spectra, see Figures S2A and S2B). Error bars, S.E.M. (n = 23 microtubules from multiple chambers for both B and C). **** p < 0.0001; *** p < 0.001. Top panels, progress curves of severing reactions; bottom panels, severing rates as in (A).
(D) Microtubule severing activity is highly sensitive to β-tubulin glutamylation levels (for mass spectra, see Figure S2C). Error bars, S.E.M. (n = 23 microtubules from multiple chambers). † p > 0.01 Top panels, progress curves of severing reactions; bottom panels, severing rates as in (A).
(E) An increase in β-tubulin glutamylation is sufficient to induce a biphasic response in microtubule severing when α-tubulin glutamylation is constant (for mass spectra, see Figure S2D). Error bars, S.E.M. (n = 24 microtubules from multiple chambers). **** p < 0.0001; ** p < 0.01. Top panels, progress curves of severing reactions; bottom panels, severing rates as in (A).

