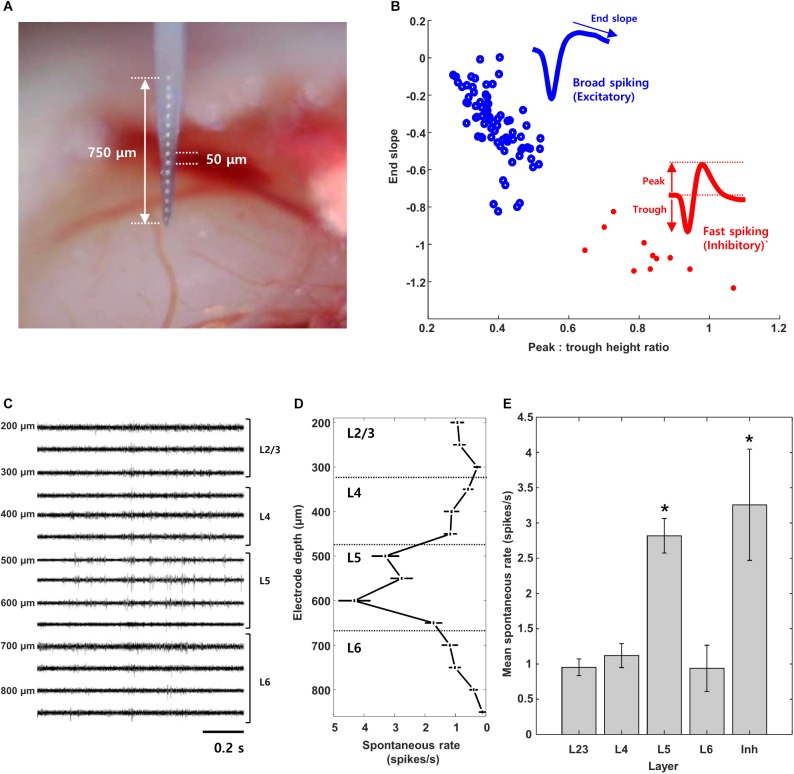
FIGURE 1.
Layer and cell type classification from multisite recording of mouse visual cortex. (A) Photograph of the 16-channel linear multisite probe used for insertion into and recording from mouse visual cortex. (B) Scatter plot of spike waveform features used to classify cells into excitatory (broad spiking, n = 74) and inhibitory (narrow spiking, n = 11) types; the average waveforms of broad and fast spiking cells are shown as well. (C,D) Raw waveforms and mean spontaneous rate recorded simultaneously from 14/16 channels during a single insertion of the probe. (E) Mean spontaneous rate of excitatory cells from each layer and of inhibitory cells pooled across all layers. (L2/3: 15 cells, L4: 18 cells, L5: 29 cells, L6: 16 cells, Inh.: 12 cells), Error bars denote standard error mean (SEM). ∗indicates p < 0.05.

