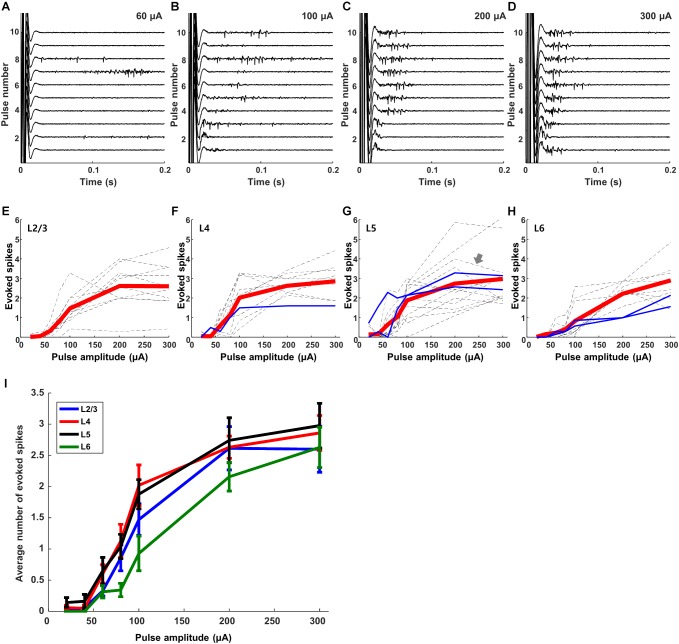
FIGURE 4.
Responses to electric stimulation are sensitive to pulse amplitude. (A–D) Raw waveforms recorded in response to electric stimulation from a typical L5 excitatory cell. Each panel shows the response to 10 consecutive pulses; amplitudes are 60, 100, 200, and 300 μA in the 4 panels, respectively. (E–H) Dotted gray and blue lines indicate average responses as a function of amplitude from individual excitatory and inhibitory cells, respectively (L2/3: 10 cells, L4: 10 cells, L5: 14 cells, L6: 10 cells). Thick red lines in each graph indicate the average response across all cells within the layer. (I) Overlay of the average responses from each layer (the red lines from panels E–H).

