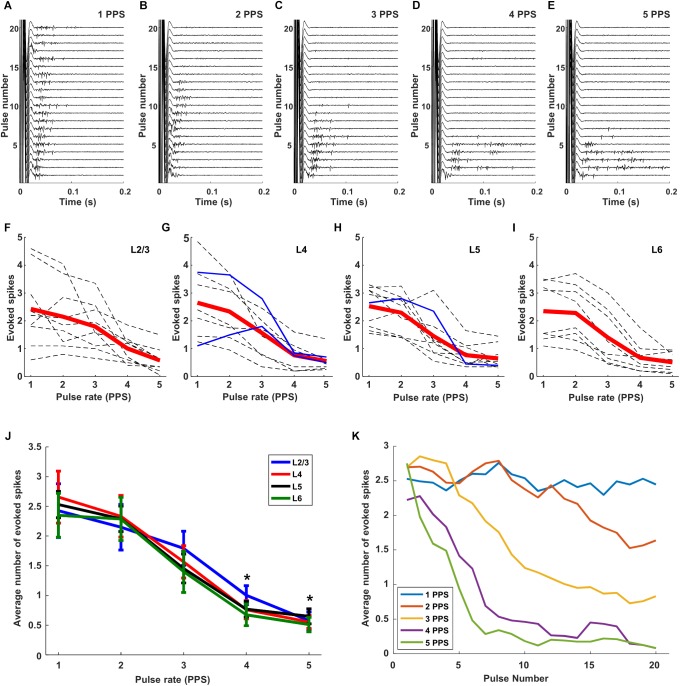
FIGURE 6.
Responses are suppressed by increasing rates of stimulation. (A–E) Raw responses from a typical L5 excitatory cell to 20 consecutive pulses at 300 μA; rates of 1, 2, 3, 4, and 5 PPS, respectively, were applied. (F–I). Dotted gray and blue lines are the mean responses from individual excitatory and inhibitory cells, respectively (L2/3: 9 cells, L4: 9 cells, L5: 10 cells, L6: 8 cells). Thick red lines indicate the average response across all cells from the layer. (J) Overlay of average response curves from all layers. ∗indicates p < 0.05. (K) Response strength versus stimulus number averaged across all layers. Error bars omitted for clarity.

