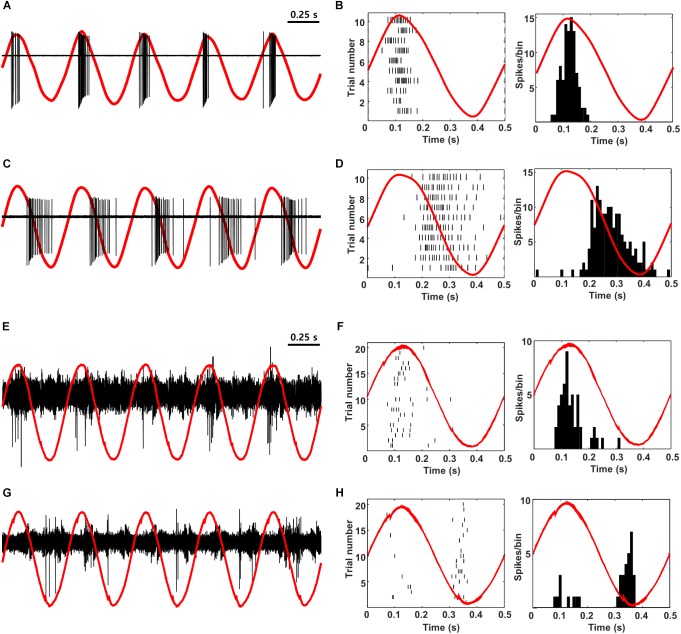
FIGURE 8.
ON vs. OFF selectivity is preserved during propagation from the retina to V1. (A,C) Raw in vitro response (black) and stimulus waveform (red) from a typical ON and OFF RGC in response to 2-Hz sinusoidal stimulation. (B,D) Raster plot (left) and PSTH (right) for the same cells. The red traces are a single period of the stimulus waveform aligned to showing timing of the responses. (E,G) Raw response (black) and stimulus waveform (red) from a typical L4 ON cell (E) and a typical L2/3 OFF cell (G) in response to 2-Hz sinusoidal stimulation (100 μA). (F,H) Raster plot (left) and PSTH (right) for the same cells. The red traces are a single period of the stimulus waveform aligned to showing timing of the responses. Note that anodal phases appear as upward and cathodal as downward in all panels (Methods).

