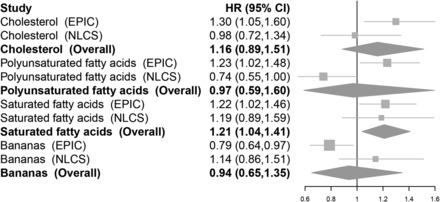
FIGURE 2.

Forest plots showing multivariate HRs and 95% CIs for comparisons of the highest and lowest categories of intake of 4 foods and nutrients in relation to epithelial ovarian cancer risk in the EPIC study and the NLCS. Foods and nutrients were evaluated if they had a P value <0.05 for the comparison of extreme quartiles of dietary intake in the EPIC study based on results from multivariate-adjusted Cox proportional hazards regression. Overall risk estimates were estimated from random-effects meta-analysis. P-heterogeneity comparing the EPIC study and the NLCS were ≥0.14 with the following exceptions: PUFAs (P-heterogeneity = 0.01) and bananas (P-heterogeneity = 0.04). Multivariate models were adjusted for total energy intake, oral contraceptive use, menopausal status, and parity and were stratified by age (both studies) and study center (EPIC only). Contrasts and median intake values were cholesterol (EPIC: quartile 4, 334.7 mg/d compared with quartile 1, 148.5 mg/d; NLCS: quartile 4, 292.3 mg/d compared with quartile 1, 164.1 mg/d), polyunsaturated fat (EPIC: quartile 4, 14.5 g/d compared with quartile 1, 7.0 g/d; NLCS: quartile 4, 21.1 g/d compared with quartile 1, 7.9 g/d), saturated fat (EPIC: quartile 4, 29.6 g/d compared with quartile 1, 17.4 g/d; NLCS: quartile 4, 34.3 g/d compared with quartile 1, 22.0 g/d), and bananas (EPIC: quartile 4, 62.4 g/d compared with quartile 1, 0 g/d; NLCS: highest, 32.1 g/d compared with lowest, 0 g/d). EPIC, European Prospective Investigation into Cancer and Nutrition; NLCS, Netherlands Cohort Study.
