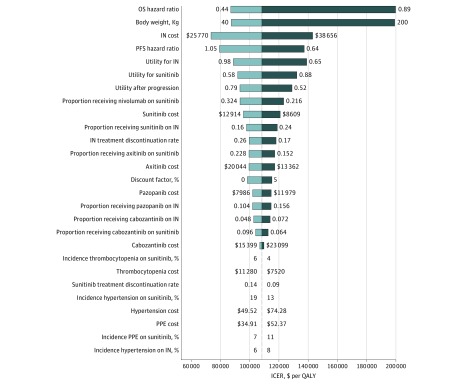
Figure 1. The Results of Univariable Sensitivity Analysis.
This diagram shows incremental cost-effectiveness ratio (ICER) of nivolumab plus ipilimumab (IN) vs sunitinib for different model input parameters. The dotted line intersecting the light and dark blue bars represents the ICER of $108 363 per quality-adjusted life-year (QALY) from the base case results. OS indicates overall survival; PFS, progression-free survival; PPE, palmar-plantar erythrodysesthesia.

