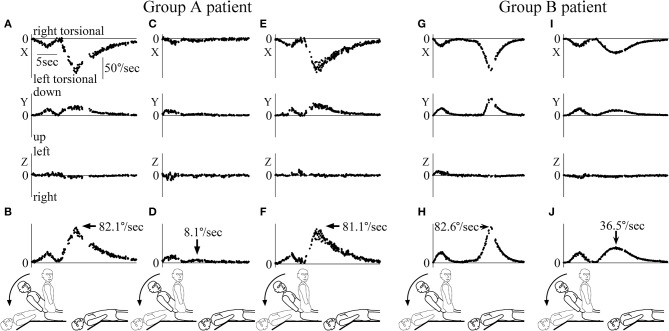
Figure 4.
Three-dimensional axis angles of slow phase eye velocity (SPEV) during and after the head movement of the Dix-Hallpike test. The scales of all graph are identical to that shown in (A). (A) Three-dimensional axis angle of SPEV of the patient whose data are shown in Figure 3 during the first Dix-Hallpike test. Highest column: X component (torsional component), middle column: Y component (vertical component), lowest column: Z component (horizontal component). These data were calculated from the axis angles of eye position data during the first Dix-Hallpike test, at the part shown by a solid double head arrow in Figure 3. (B) SPEV around the eye rotational axis calculated from the data shown in (A). (C) Three-dimensional axis angle of SPEV of the patient whose data are shown in Figure 3 during the second Dix-Hallpike test. These data were calculated from the axis angles of eye position data during the second Dix-Hallpike test, at the part shown by a dotted double head arrow in Figure 3. The clear peak of positional nystagmus seen in (A) could not be seen either in X or Y component. (D) SPEV around the eye rotational axis calculated from the data shown in (C). (E) Three-dimensional axis angle of SPEV of the patient whose data are shown in Figure 3, during the third Dix-Hallpike test. (F) SPEV around the eye rotational axis calculated from the data shown in (E). The value of the maximum SPEV (MSPEV) was almost same with the value of MSPEV during the first Dix-Hallpike test shown in (B). (G) Three-dimensional axis angle of SPEV of a patient who was allocated to group B during the first Dix-Hallpike test. (H) SPEV around the eye rotational axis calculated from the data shown in (G). (I) Three-dimensional axis angle of SPEV of the patient whose data are shown in (G,H) during the second Dix-Hallpike test. (J) SPEV around the eye rotational axis calculated from the data shown in (I). The value of the MSPEV became approximately half of the value of MSPEV shown in (H).

