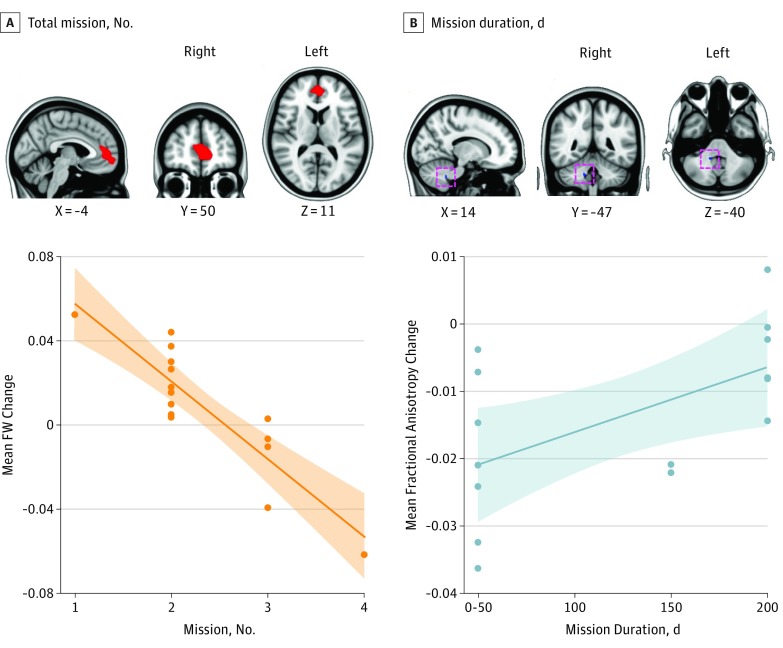
Figure 3. Association of Spaceflight With Free Water (FW) Distribution and Fractional Anisotropy (FAT) Measures.
The clusters show brain areas where there was a significant association between the preflight to postflight change in FW and the total count of missions (A) and spaceflight-associated FA change and the mission duration (B) (P < .05; familywise error corrected). The results are overlaid on the Montreal Neurological Institute standard space brain template. The orange scatterplot depicts the mean change in FW of the cluster shown as a function of the number of missions. The blue scatterplot shows the mean change in FA of the cluster shown as a function of the current mission duration. The mission duration is expressed in bins of 50-day increments to prevent identification of individuals based on flight duration.

