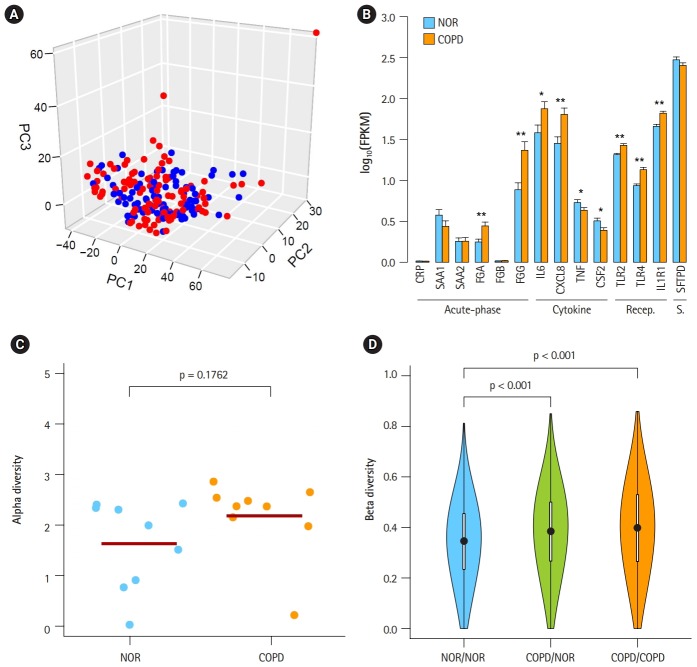
Fig. 1.
Heterogeneous chronic obstructive pulmonary disease (COPD) samples in the mild stage. (A) Principal component analysis plot depicting relative similarities between COPD samples (red) and normal (NOR) samples (blue) using previously identified differentially expressed genes. (B) Expression levels of COPD marker genes. Recep., receptor; S., surfactant; NOR. normal. *p < 0.01, **p < 0.0001 by student’s t-test. (C) Alpha diversity of VJ combinations in IGK. (D) Beta diversity showing an inverse relation with the compositional similarity between samples in terms of VJ combinations in IGK. p-values were calculated after 1,000 per bmutation.

