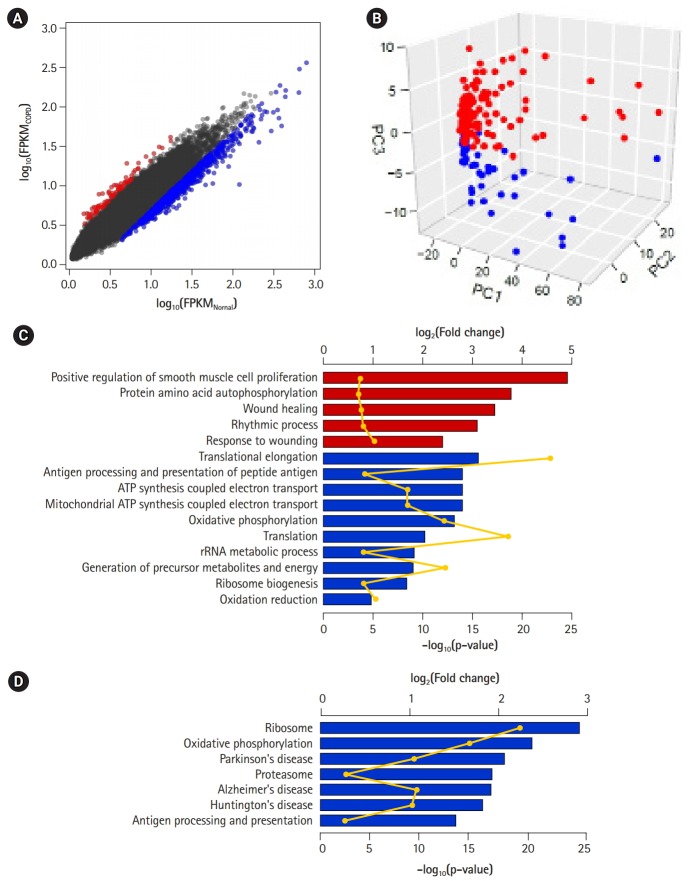
Fig. 3.
Differentially expressed genes (DEGs) between chronic obstructive pulmonary disease (COPD) and normal tissue. (A) Scatterplot of gene expression levels. Red and blue dots represent up-regulated and down-regulated genes in COPD compared with normal tissue, respectively. (B) Principal component analysis plot depicting relative similarities between COPD samples (red) and normal samples (blue) using DEGs. (C, D) Biological functions (C) and pathways (D) highly enriched in up-regulated (red) and down-regulated (blue) genes. Individual bars demonstrate fold-changes relative to background, and lines display their p-values.

