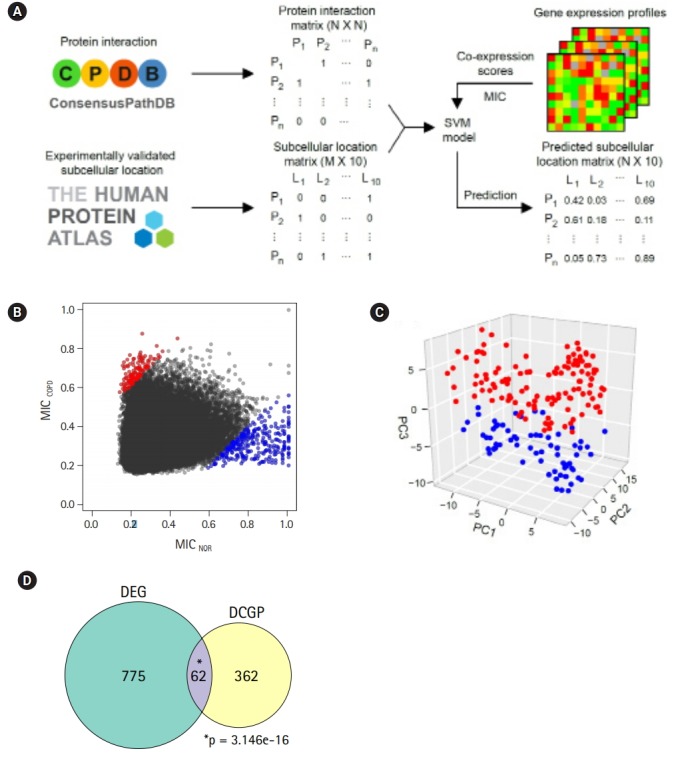
Fig. 5.

Differentially expressed pairs (DEPs) between chronic obstructive pulmonary disease (COPD) and normal (NOR) samples. (A) Pipeline to predict protein sublocalization from gene expression profiles. (B) Maximal information coefficient (MIC) scores for describing coexpression changes between two genes. Red and blue dots represent up-regulated and downregulated pairs in COPD compared with NOR samples, respectively. (C) Principal component analysis plot depicting relative similarities between COPD (red) and NOR samples (blue) using DEPs. (D) Venn diagram showing overlap between differentially expressed genes (DEGs) and DEPs. DCGP, differentially co-expressed gene pairs. p-values were calculated by hypergeometric test.
