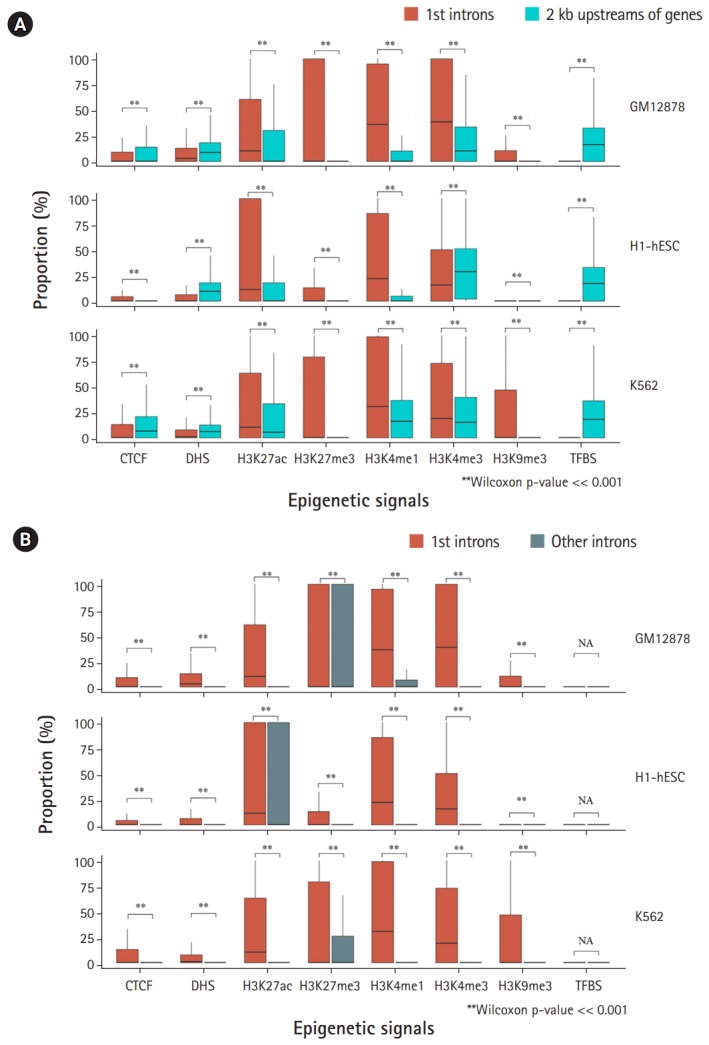
Fig. 1.

Comparison of the proportions of rare alleles in the first introns, in the 2-kb upstream regions, and in other downstream introns. (A) The proportions of rare alleles assigned to each chromatin mark located in the first introns and the 2-kb upstream regions of genes were estimated and plotted using the box plot method (see Methods). (B) The proportions of rare alleles assigned to each chromatin mark located in the first introns and other downstream introns. CTCF, CCCTC-binding factor; DHS, DNaseI hypersensitive site; TFBS, transcription factor binding site; N/A, not available. **Statistical significance estimated by a p-value much less than 0.001 from the Wilcoxon rank-sum test.
