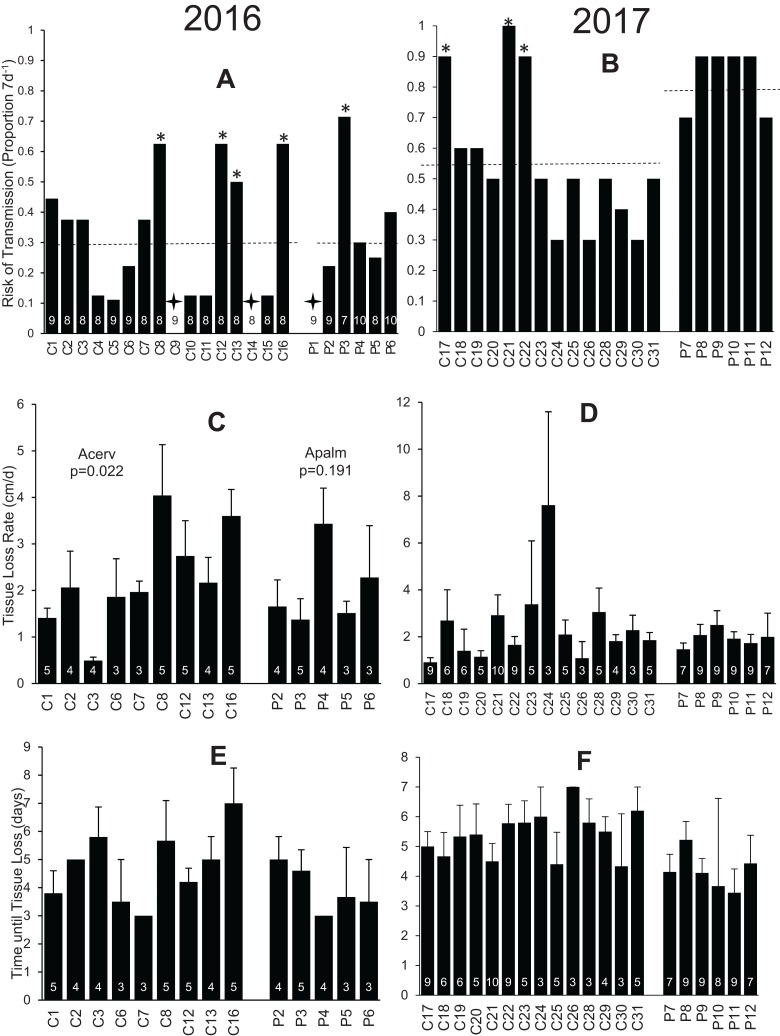
Figure 1. Results of disease susceptibility assays conducted in 2016 (A, C, E) and 2017 (B, D, F).
(A and B) the risk of transmission (i.e., the proportion of replicate ramets of each genotype in which the elicitation of a tissue loss lesion was observed following the application of an inoculant fragment); (C and D) the average rate of progression of tissue loss for genotypes with at least three responding replicates; and (E and F) the average time until a lesion was observed for genotypes with at least three responding replicates. Genotype designations (given along the x-axis) are identified in Table S1. The number of replicates for each genotype is given inside or above each bar while error bars indicate +1SE. In A and B, dashed lines show the pooled population risk of infection for each species, asterisks indicate genotypes that differed significantly from this expected transmission risk, and crosses indicate zero transmission observed for that replicate (though power for the Pearson Chi-squared test was inadequate to conclude that zero differed from expected).

