

Abstract
The purpose of this study was to test two competing hypotheses about the nature of the impairment in apraxia of speech (AOS). The Reduced Buffer Capacity Hypothesis argues that people with AOS can hold only one syllable at a time in the speech motor planning buffer. The Program Retrieval Deficit Hypothesis, states that people with AOS have difficulty accessing the intended motor program in the context where several motor programs are activated simultaneously. The participants included eight speakers with AOS, most of whom also had aphasia, nine speakers with aphasia without AOS, and 25 age-matched control speakers. The experimental paradigm prompted single word production following three types of primes. In most trials, prime and target were the same (e.g., bill-bill). On some trials, the initial consonant differed in one phonetic feature (e.g., bill-dill; Similar) or in all phonetic features (fill-bill; Different). The dependent measures were accuracy and reaction time. The results revealed a switch cost – longer reaction times in trials where the prime and target differed compared to trials where they were the same words – in all groups; however, the switch cost was significantly larger in the AOS group compared to the other two groups. These findings are in line with the prediction of the Program Retrieval Deficit Hypothesis and suggest that speakers with AOS have difficulty with selecting one program over another when several programs compete for selection.
1. Introduction
Apraxia of speech (AOS) is a motor speech disorder that is characterized primarily by slow speech rate, distorted speech sounds, frequent pauses between words or syllables, and perception of equal stress across syllables (Ballard et al., 2015). AOS results from neurological damage, such as stroke (Ziegler, 2008) or neurodegenerative disease (Josephs et al., 2013). Although the precise lesion locations resulting in AOS are still debated, most recent studies implicate a network of regions in the dominant hemisphere, including the posterior part of the inferior frontal lobe, premotor and supplementary motor areas, motor cortex, insula, and the sensorimotor cortex (Basilakos et al., 2015; Graff-Radford et al., 2014; Hickok et al., 2014; McNeil et al., 2016). AOS may occur in isolation but the underlying pathology typically affects language function as well, so that it most commonly co-occurs with acquired language impairment (aphasia); in some cases, muscle weakness or incoordination of movements affecting speech (dysarthria) may also be present (Duffy, 2005; Ziegler, 2008). The frequent co-morbidity of these diagnoses adds to the theoretical and clinical challenge from a diagnostic and treatment perspective because impairments may arise at various stages of language formulation, speech motor planning, or both.
Researchers agree that the core problem in AOS is an impairment at the level of speech motor planning (Ballard et al., 2000; Duffy, 2005; McNeil et al., 2009; Ziegler, 2008). How speech motor planning operations fail in AOS remains unclear, although several hypotheses have been proposed to explain the underlying impairment. A more specific understanding of the speech motor planning impairment is critical for advancing translational research on AOS, particularly the development of theoretically grounded tools for differential diagnosis and effective treatments that specifically target the speech motor planning impairment.
1.1. Theoretical framework
One of the obstacles for the study of AOS has been the under-specification of speech production models at the level of speech motor planning. This stage straddles the boundary between the domains of language processing and speech processing which are typically addressed in separate models. Speech motor planning falls at the periphery of models that focus on each domain respectively (Ziegler, 2002). In recent years, however, there have been considerable improvements in our understanding of speech motor control (e.g., Guenther et al., 2006; Perkell, 2012) and its interaction with language-level processing, such as phonological encoding (Bohland et al., 2010). While models of speech production (Bohland et al., 2010; Dell, 1986; Guenther et al., 2006; Levelt et al., 1999) differ from one another in some aspects, a few key assumptions, critical in the context of this study, are shared by these models. These are that (a) speech production unfolds via several stages (e.g., lexical retrieval, phonological encoding, speech motor planning, articulation), and (b) the different stages incorporate processes by which units are sequentially activated and their activation temporarily maintained in anticipation of the next stage. This research draws primarily on the theoretical framework of the DIVA (Directions into the Velocities of Articulators; Guenther, 2016) model and its extension, the GODIVA (Gradient Order DIVA; Bohland et al., 2010), because these models are currently the most specific at the stage of speech motor planning providing the basis for specific predictions about the hypotheses.
The DIVA model is a detailed neurocomputational model of speech motor control. The basic architecture of DIVA includes two subsystems: the feedforward control and the feedback control. The feedforward control system operates via sequential activation of previously learned motor routines that guide speech articulation. The feedback control encodes the expected auditory feedback and compares it to the actual speech signal produced by the speaker. It is the responsibility of the feedback system to correct and update the feedforward control if a mismatch is detected between the expected and the actual feedback. While the feedback system plays a major role in development when feedforward commands are learned and fine tuned, an adult speaker relies primarily on the feedforward control for speech production under typical speaking conditions. The ensuing paragraphs describe speech motor planning within the DIVA model and focus specifically on the aspects of the model that are critical to follow the logic of this study.
The speech motor planning stage refers to the phase in speech production where an abstract linguistic message is transformed into motor programs – cognitive representations that guide articulation (Ziegler, 2008). The unit of operation at this level is a speech motor program, which in DIVA may correspond to different linguistic units, such as phonemes, syllables, or whole phrases for frequently occurring utterances, but the primary motor programming unit corresponds to a syllable. In case a linguistic message has corresponding motor representations at different chunk sizes, the system will look for the largest chunk that corresponds to the utterance planned at the linguistic processing stage (Guenther, 2016).
The speech motor planning stage receives input from the phonological encoding stage which is responsible for assembling the sound structure (sequence of phonemes) and the metrical structure (syllable shapes and stress patterns), and combining the two into a phonological word. As the first segments of the phonological word become available, they start activating the corresponding speech motor program representations (speech sound map cell in the DIVA model; Guenther et al., 2006). In this process, the program that represents a perfect match to the phonological unit becomes activated but so do the programs that represent a partial match. In addition, speech articulation is a sequential process – speech units are articulated over time – which means that representations for the upcoming syllables have to be held in short term memory before being selected and passed on to the upcoming processing stage. In the DIVA model, this is achieved via parallel activation of the upcoming speech sound where the sequential order is represented in the activity gradient of the upcoming units such that the activity level of the first unit in the utterance has the highest activation relative to the next unit, which in turn has a higher activity level than the following unit and so on. Additional excitatory and inhibitory connections between the competing representations via direct and indirect pathways through basal ganglia help resolve the competition. Once the activation of the best matching program achieves the selection threshold, it will serve as input to the motor units in the primary motor cortex, initiating the next stage in speech production – execution of the speech movements. The cells representing the selected program are actively inhibited after selection to avoid reselection (Bohland et al., 2010).
According to this architecture, there are at least two independent sources of competition at the level of the speech motor planning (located at the level of the Speech Sound Map in DIVA terms). One of them is phonetic similarity between different motor programs. Due to partial match, similar motor programs receive input from the same representations at the phonological level. The other is competition between the present target and upcoming units in the utterance. In addition, the largest degree of competition should follow from the interaction between the two, when the upcoming units in the utterance are also phonetically similar to one another.
1.2. Speech motor planning impairment in AOS
Relatively few studies have investigated the underlying impairment in AOS. Nevertheless, different hypotheses to account for the behaviors that are characteristic of this disorder have been proposed (e.g., Aichert and Ziegler, 2004; Deger and Ziegler, 2002; Maas et al., 2008; Mailend and Maas, 2013; Varley and Whiteside, 2001). Three of the major hypotheses in the literature are reviewed here, which will be referred to as the Damaged Programs Hypothesis, the Program Retrieval Deficit Hypothesis, and the Reduced Buffer Capacity Hypothesis.
The Damaged Programs Hypothesis generally asserts that the representations that encode the movement patterns (often referred to as ‘speech motor programs’; i.e., the projection from the Speech Sound Map to the primary motor cortex in terms of the DIVA model) are impoverished or incompletely specified in AOS (Aichert and Ziegler, 2004). Several sources of evidence support this hypothesis. For example, Aichert and Ziegler (2004) conducted a study which showed that syllable properties, such as syllable frequency and syllable structure, play a role in apraxic speech errors suggesting that speakers with AOS have access to syllable-sized speech motor programs but these representations are susceptible to damage which, in turn, appear to be influenced by syllable frequency. Maas et al. (2015) approached this question from a different angle. They used noise-masking to prevent access to auditory feedback as the study participants produced words. If speech motor programs are underspecified or impoverished, speakers would have to rely on their intact feedback mechanism to achieve the target speech sounds. This predicts that speech sound contrast (operationalized as acoustic vowel distinctiveness) is reduced when feedback is masked compared to normal feedback conditions. Results from the Maas et al. (2015) study showed that speakers with AOS indeed produced smaller contrasts between different vowels under the masking conditions compared to silent trials, and that this reduction was larger for the AOS group compared to age-matched controls without neurological impairments.
An alternative hypothesis, termed here the Program Retrieval Deficit Hypothesis, suggests that the core problem in AOS is in activating (and/or selecting) the intended speech motor program particularly in a context where other motor programs compete for selection due to similarity or recent activation from different input. Within the DIVA framework, this can be modeled either as (a) difficulty reaching the threshold for individual program representations due to inadequate connections between the phonological and the speech motor program representations or (b) inability to resolve the competition among the representations. Discriminating between these alternatives is not within the scope of this study. The Program Retrieval Deficit Hypothesis is akin to a major class of hypotheses in other cognitive domains which propose loss of access to intact representations as the core deficit for memory impairments (e.g., Chertkow and Bub, 1990; Shallice, 1988) and language impairments (e.g., Hula and McNeil, 2008; Schwartz et al., 2006).
The evidence in support of this hypothesis was presented by Mailend and Maas (2013) who contrasted the Program Retrieval Deficit Hypothesis with the Damaged Program Hypothesis in a delayed reaction time paradigm. The participants were asked to say a pre-specified word in response to a go-signal. On some trials, they heard another word just prior to speaking, other trials were silent without distracters. While neurologically healthy control speakers were unaffected by the distracters as evidenced by comparable reaction times in silent trials and trials with distracters, speakers with AOS showed significantly longer reaction times when distracters were presented. The interference from the distracter was predicted by the Program Retrieval Deficit Hypothesis; it is consistent with the idea that speakers with AOS have difficulty with activating the intended motor program over its competitors, difficulty that was artificially exacerbated by the distracters in this experiment.
While the hypothesis of Damaged Programs alone cannot explain the results in the study by Mailend and Maas (2013), a third hypothesis of AOS has been proposed which is also consistent with these findings, namely the Reduced Buffer Capacity Hypothesis (Rogers and Storkel, 1999). According to this view, the speech motor planning buffer is limited in speakers with AOS to fit no more than one syllable-sized motor program at a time, forcing speakers with AOS to plan their utterances syllable-by-syllable. In terms of the theoretical framework, this means that the speaker cannot activate the representations of several speech motor programs simultaneously. In order to produce a multisyllabic utterance, the first motor program has to reach the selection threshold, be selected and, right after selection, inhibited before the next representation in the planning buffer can be activated.4
The study by Mailend and Maas was not designed to test the Reduced Buffer Capacity Hypothesis directly but the authors acknowledge that the pattern of results could be explained also by that hypothesis. Namely, it is possible that rather than competing for selection simultaneously with the target, the distracter replaced the pre-activated motor program in the motor planning buffer. In this case, the extended reaction time in the distracter conditions would be explained by a need to inhibit the motor program for the distracter and reactivate the intended motor program that corresponds to the target. The purpose of the current study was to test the Reduced Buffer Capacity Hypothesis and the Program Retrieval Deficit Hypothesis directly under an experimental paradigm where these hypotheses each predict a different outcome.
1.3. The reprogramming paradigm
One of the difficulties associated with the study of speech motor planning impairment in AOS is establishing an experimental paradigm that allows the manipulation of the speech motor planning operation independently from the operations at the stages that precede and follow speech motor planning. Utterances that require more effort at the level of speech motor planning are typically also complex in terms of phonological encoding and/or articulation. In this study, a so-called reprogramming paradigm (also called response priming paradigm; Rosenbaum and Kornblum, 1982) is used, which has proven useful for examining speech motor planning in typical speakers (Meyer and Gordon, 1985; Yaniv et al., 1990) and in speakers with hypokinetic dysarthria (Spencer and Rogers, 2005). In this paradigm, participants prepare to produce a word in advance and then say the word in response to a go-signal. On some trials, the go-signal specifies a word other than what the participants had prepared. This requires the speaker to inhibit the prepared response and quickly plan the new response. The extra processing time needed for these operations is evident in longer reaction times compared to baseline trials where switching to a new response is not needed. In addition, typical speakers need more time to switch between phonetically similar items (e.g., bill and dill which differ in one phonetic feature: place of articulation) compared to switching between dissimilar items (e.g., bill and fill), whose onsets do not share any phonetic features (Meyer and Gordon, 1985; Rogers and Storkel, 1998; Spencer and Rogers, 2005; Spencer and Wiley, 2008; Yaniv et al., 1990). This effect is referred to as the phonetic similarity effect, and it has been taken as evidence that reprogramming the speech motor planning buffer is more costly when the operation involves phonetically similar items, because of the competition between similar speech motor programs as described above.
Because all speakers have to go through the above-described processes, all participants are expected to show a switch cost: longer reaction times in trials where prime and target are different words compared to trials where the prime and target are identical. The critical aspect of this task for the current study is that the participant has no need to plan and hold on to more than one speech motor program at any time throughout this experiment. The necessity to plan only a single syllable at a time generates different predictions for the two hypotheses. According to the Reduced Buffer Capacity Hypothesis, speakers with AOS should demonstrate a switch-cost that is similar to the other groups because the operations in this task are within the limits in which the motor planning buffer operates in speakers with AOS. The Program Retrieval Deficit Hypothesis, in contrast, predicts a switch cost of a greater magnitude in the AOS group compared to the Control group. In switch trials, the prime activates a competing speech motor program is not actually produced within the trial. If the difficulty in AOS is in selecting one motor program over another, then this paradigm artificially exacerbates this problem by providing a boost in activation to a competing speech motor program via the prime that is not selected for production and thereby does not undergo post-selection inhibition. The Program Retrieval Deficit Hypothesis, therefore, predicts an exaggerated switch cost in speakers with AOS and a greater number of speech errors where the participant produces the prime rather than the target word in switch trials in comparison to other groups. Because this paradigm only requires a monosyllabic response from the participants, the conclusions that can be drawn from this task remain silent about the observations of apraxic speech that involve larger units than a syllable (e.g., increased sound errors (Ziegler, 2005, 2009) or stress errors (Vergis et al., 2014) in iambic compared to trochaic feet), which may result from the need to plan more than what the system is capable of.
The reprogramming paradigm requires the participant to abandon a preprogrammed utterance and encode a new utterance which must include operations at the stage of phonological encoding as well as speech motor planning. To minimize the effect at the phonological encoding stage, we present the stimuli in written form which allows direct access to phonological representations (e.g., Lukatela and Turvey, 1994a, 1994b) and diminishes the need for phonological encoding compared to pictured stimuli where phonemes are activated via semantic-lexical mapping (Schwartz et al., 2006). Ultimately, the specificity of our findings to the speech motor planning phase will be examined by comparing the results of speakers with AOS and aphasia to those with aphasia without AOS. Consequently, this study may also provide further evidence to the claim that the paradigm affects primarily the speech motor planning level of speech production (Jones et al., 2010; Spencer and Rogers, 2005). This interpretation would find further support if speakers with AOS show a different pattern from control speakers and speakers with aphasia without AOS.
Another important assumption of this paradigm is that the participants prepare the prime for production, that is the phonologic planning phase is complete and the participant has activated the motor program that best matches the phonologic words before the target word is presented. As a check on whether participants prepare the prime, we expect a so-called switch cost – faster reaction time when the target matched the prime than when it did not. In that regard, findings from the novel use of this paradigm will speak to the ability of people with AOS and aphasia to maintain the activation for a planned utterance.
Finally, although this study was not specifically designed to test the Damaged Programs Hypotheses of AOS, it does predict an outcome that is similar to the Reduced Buffer Capacity Hypothesis but distinct from the Program Retrieval Deficit Hypothesis. If the primary impairment in AOS is impoverished motor programs then this should be reflected in speech errors, particularly distortions and distorted substitutions, but not in exaggerated reaction time costs because the extended reaction time reflects a difficulty with the selection process rather than the integrity of the motor representations themselves.
In summary, several potential hypotheses about the underlying impairment in AOS have been proposed. All of them can explain some aspect of the speech motor planning impairment associated with AOS but relatively few published studies have systematically compared the different hypotheses in an attempt to provide an account of AOS that could unify the different observation under one theory of motor planning and its breakdown. The purpose of this study is to advance the theoretical groundwork on the underlying impairment in AOS by experimentally testing the Reduced Buffer Capacity Hypothesis and the Program Retrieval Deficit Hypothesis. Both offer potential explanations for the nature of the underlying impairment in AOS (Mailend and Maas, 2013; Rogers and Storkel, 1999) but they have not been compared directly to one another in a single experiment. Predictions for the hypotheses are derived from a theoretical framework of speech production (Bohland et al., 2010; Dell, 1986; Guenther, 2016; Guenther et al., 2006; Levelt et al., 1999) and tested within an experimental paradigm that has proven successful for understanding speech motor planning in unimpaired speakers but remains underutilized in the study of AOS (Maas and Mailend, 2012). In addition, the integrity of the motor programs, the ability to maintain a prepared utterance, and the specificity of the findings to the speech motor planning phase are also examined. The methodological continuity with the independent literature on speech motor planning in unimpaired speakers serves as a cross-validation point for interpretation of observed effects.
2. Materials and methods
2.1. Participants
Study participants included eight speakers with AOS (six of whom also had aphasia), nine speakers with aphasia without AOS, and 25 neurologically healthy control participants. The groups did not differ in age(F=2.89, p > 0.05) or years of education (F=0.14, p > 0.05). All participants were native monolingual or bilingual English speakers; three control speakers and two speakers with AOS also spoke another language before the age of five, based on self-report. Nine additional participants were initially recruited for this study but were excluded from the analysis because they did not meet the inclusionary criteria (no aphasia according to WAB for two participants initially recruited to the aphasia group) or because they met the exclusionary criteria: history of dyslexia according to self-report for one control participant, significant reading difficulties for three speakers with AOS and/or aphasia, additional neurological or speech diagnosis for three speakers with AOS and/or aphasia. All study procedures were approved by the Institutional Review Boards of the University of Arizona and Temple University. Participants signed a written consent before taking part in the study and they were compensated for their time at the rate of $10 per hour.
AOS was initially diagnosed by the first author who holds a clinical Master’s degree in Speech Therapy. Following the example of Haley et al. (2012), the diagnosis was made on a three-point scale (1 = no AOS, 2 = possible AOS, and 3 = AOS) with a modification that allowed 1.5 and 2.5 values to indicate “inclination towards no AOS” or “inclination towards AOS” judgments respectively. The following criteria served as the basis for AOS diagnosis: (1) slow speech rate, (2) sound distortions and distorted substitutions, and (3) impaired prosody, particularly syllable segmentation and equal stress across syllables (e.g., Ballard et al., 2015). These characteristics were examined from several different speaking tasks, including conversational speech samples, picture description, repetition of words and phrases and diadochokinetic tasks administered in the context of standardized tests (Western Aphasia Battery; WAB, Kertesz, 1982; Apraxia Battery for Adults, 2nd Edition; ABA-2, Dabul, 2000). The diagnosis was subsequently confirmed by an ASHA-certified speech language pathologist who evaluated each participant independently from video and audio recordings following the same procedure and criteria. Unanimous agreement between the first and second rater was achieved for the diagnosis of 12 of 16 participants with AOS and/or aphasia; for 2 additional participants the disagreement was within half a point, and for 2 participants the disagreement was 1 and 1.5 points respectively. For the two speakers with score discrepancies of one point or more, a third ASHA-certified speech-language pathologist independently evaluated the speech samples based on the same criteria and procedures. The final group assignment was based on the average score of the two raters (or three raters for the two speakers with discrepant AOS scores): participants with a score of 2 or more were assigned to the AOS group (Mailend and Maas, 2013), others to the aphasia group. The mean AOS rating for each participant is indicated in Table 1.
Table 1.
Participant information.
| AOS 001 |
AOS 002 |
AOS 003 |
AOS 004 |
AOS 005 |
AOS 006 |
AOS 007 |
AOS 008 |
APH 001 |
APH 002 |
APH 003 |
APH 004 |
APH 005 |
APH 006 |
APH 007 |
APH 008 |
APH 009 |
Control (N = 25) |
|
|---|---|---|---|---|---|---|---|---|---|---|---|---|---|---|---|---|---|---|
| Age | 79 | 32 | 65 | 57 | 63 | 64 | 56 | 45 | 77 | 72 | 43 | 65 | 63 | 58 | 54 | 72 | 54 | 69(8) |
| Sex | M | F | M | M | F | M | M | F | M | M | M | M | M | M | M | M | M | 20F, 5M |
| Education | 16 | 23 | 14 | 17 | 14 | 12 | 13 | 18 | 25 | 16 | 14 | 18 | 16 | 14 | 14 | 19 | 17 | 18(3) |
| Hand | R | R | R | R | R | R | R | R | R | R | R | R | L/R | R | L/R | R | L/R | |
| Language | AE | AE | SE | AE | AE | AE | AE | AE | BE | BE | AE | AE | AE | AE | AE | AE | AE | |
| TPO (y;m) | 5;6 | 0;10 | 7;1 | 1;4 | 11;0 | 9;6 | 5;8 | 0;6 | 1;0 | 10;9 | 6;8 | 5;7 | 1;1 | 7;0 | 3;11 | 1:9 | 3;7 | |
| Aphasia typea | Anm | Broc | Cnd | wnl | Cnd | wnl | Anm | Anm | Anm | Cnd | Anm | Anm | Anm | Anm | Anm | Wer | Cnd | |
| WAB AQa | 81.1 | 61.0 | 82.3 | 96.8 | 73.6 | 96.0 | 92.1 | 91.4 | 80.4 | 66.8 | 91.6 | 85.9 | 92.3 | 82.5 | 89.1 | 59.8 | 74.2 | |
| Repetitiona | 7.4 | 4.6 | 6.4 | 9.6 | 5.5 | 9.6 | 9.4 | 7.0 | 8.4 | 5.8 | 8.0 | 8.6 | 10.0 | 7.5 | 7.8 | 2.3 | 3.5 | |
| ASRSb | 31 | 30 | 19 | 13 | 18 | 20 | 9 | 22 | 2 | 5 | 4 | 4 | 0 | 6 | 1 | 4 | 8 | |
| AOS ratingc | 3 | 3 | 3 | 3 | 3 | 3 | 2.5 | 3 | 1 | 1.83 | 1 | 1.25 | 1 | 1.75 | 1 | 1 | 1.83 | |
| Oral apraxiad | mild | none | mild | none | mild | none | mod | none | mild | mild | none | mod | none | none | none | none | none | |
| Limb apraxiad | none | none | none | none | none | none | none | none | none | none | none | sev | none | none | none | none | none | |
| Dysarthriae | mild | none | mod | none | mild/mod | none | none | none | none | none | none | none | none | none | none | none | none | |
| Picture Span FWf | n/a | 3 | 2 | 5 | 3 | 4 | 2 | 3 | 3 | 2 | 3 | 4 | 3 | 2 | 3 | 2 | 2 | 4.9 (0.7) |
| Picture Span BWf | n/a | 2 | 0 | 4 | 2 | 3.5 | 2 | 3 | 2.5 | 2.5 | 3.5 | 4 | 2.5 | 2 | 2 | 2 | 2 | 4.2 (0.9) |
AE – American English; SE – Spanish-English bilingual; BE – British English; Anm – Anomic; Broc – Broca’s; Cnd – Conduction, wnl – within normal limits; Wer – Wericke’s; n/a – not available.
based on WAB (Kertesz, 1982).
sum of all ratings on the Revised Apraxia of Speech Rating Scale (Clark et al., 2016).
rating across three diagnosticians (1 = no AOS, 2 = possible AOS, 3 = AOS).
based on ABA-2 (Dabul, 2000) and clinical judgment.
dysarthrias were diagnosed perceptually based on a motor speech exam (Duffy, 2005) and were all of the unilateral upper motor neuron type.
forward and backward version of picture span (DeDe et al., 2014).
To further characterize the participants’ speech and to establish the severity of AOS, the Revised Apraxia of Speech Rating Scale (Clark et al., 2016; Strand et al., 2014) was used to judge speech samples of all participants with AOS and/or aphasia. Judgments on the rating scale were based on reviewing video recordings of the same speech samples used for AOS diagnosis. The total score from the rating scale is presented in Table 1. Note that the suggested cut-score for AOS on the scale (the total of 8 or more points on the rating scale; Strand et al., 2014) confirms the clinical diagnosis of AOS for all speakers with AOS/aphasia except for APH 009 who scored just in the range of AOS (total score = 8) despite the clinical judgement that AOS was not present in this speaker.
Aphasia diagnosis was based on the WAB (Kertesz, 1982). All participants with AOS and/or aphasia were administered a short-term memory and working memory test that has been psychometrically validated for use with people with language impairments (forward and backward versions of the picture span; DeDe et al., 2014); the highest span is reported for both recall directions. General cognitive state of the participants was assessed with the Mini Mental State Examination (MMSE; Folstein et al., 1975). The two patient groups did not differ from one another on any of these background variables (WAB AQ: t = 0.69, p > 0.05; WAB Repetition score: t = 0.51, p > 0.05; Picture Span Forward: t = 1.13, p > 0.05; Picture Span Backward: t = −0.43, p > 0.05; MMSE: t = 1.59, p > 0.05; Time Post Onset: t = 0.59, p > 0.05). Oral mechanism exam (Duffy, 2005) was administered when dysarthria was suspected; three of the speakers with AOS were judged to have some degree of dysarthria of the unilateral upper motor neuron kind (see Table 1). All participants in the AOS and the Aphasia group demonstrated the ability to read the experimental stimuli (all prime and target words) before the experiment. Accuracy of 80% or higher on first attempt served as inclusion criteria.
2.2. Task and procedure
The experiment involved a reprogramming paradigm (Spencer and Rogers, 2005) in which participants produced a single-word target after a visual prime (Fig. 1). Following an asterisk (500 ms), a prime appeared on white background in UPPER CASE in the center of the screen and participants prepared to produce it. Once they were ready to respond they pressed the space bar to indicate that they were ready to proceed (he., the self-select modification based on Maas et al., 2008). The key-press initiated a delay period which varied randomly between 1700 and 2700 ms.
Fig. 1.
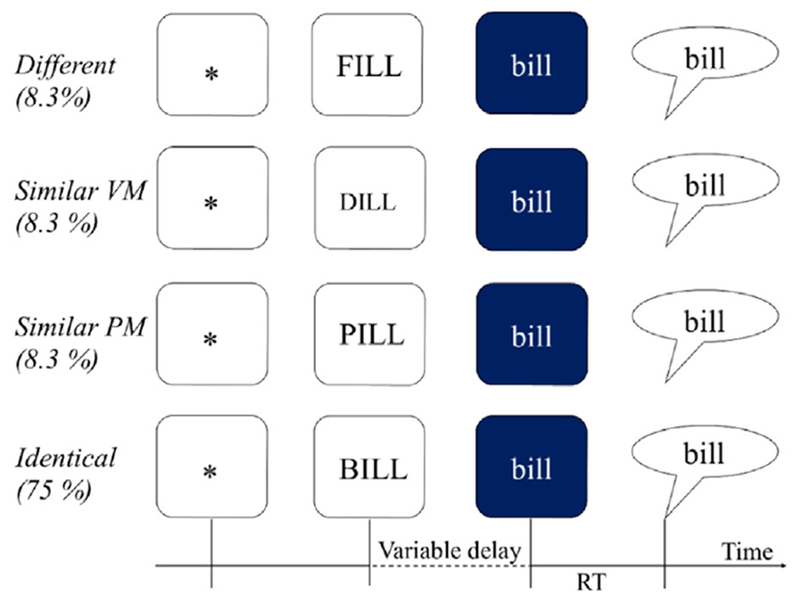
Experimental task with visual primes in open squares and target words in filled squares.
At the end of the delay, the target replaced the prime and the color of the background turned blue. The change in background color acted as the go-signal. Simultaneously with the screen color change, a tone was sent to one channel of the CD Recorder to enable reaction time measurement from the acoustic record; this tone was not audible to the participant. Participants were instructed to say the word on the blue background as quickly as possible. In 75% of trials, the prime predicted the target exactly (Identical condition), allowing and encouraging participants to prepare the prime for production. In 25% of trials, however, the target differed from the prime and required quick switching between motor programs: rapid inhibition of the motor program corresponding to the prime, and reprogramming the response for the target (Spencer and Rogers, 2005).
Participants were tested individually in a quiet room. Including breaks between blocks, the experiment was completed in a single experimental session in approximately 45 min total. Other sessions were devoted to background testing and another experiment.
2.3. Materials
The stimuli for this experiment consisted of 24 regularly-spelled English words (see Table 2). All words were four characters and three phonemes in length and had a CVC syllable structure. The stimuli were organized into six prime-target pairs to create four conditions where the phonetic similarity between the prime and the target was manipulated. The primes were presented in UPPER case, targets in lower case. The case difference helped to break up the visual continuity and similarity between the prime and the target stimuli to minimize the possibility that the observed effects stemmed from visual processing or letter-to sound decoding rather than (or in addition to) speech motor planning. In addition, regularly spelled written words rather than pictures were used as stimuli to minimize the demand on phonological processing.
Table 2.
Materials: targets and primes by condition, where target-prime stimuli were identical, similar in place/manner (PM) or voicing/manner (VM), or different in all features.
| Target | Identical | Similar PM | Similar VM | Different |
|---|---|---|---|---|
| teal | TEAL | DEAL | PEEL | MEAL |
| pail | PAIL | BAIL | TAIL | RAIL |
| cane | CANE | GAIN | PANE | RAIN |
| bill | BILL | PILL | DILL | FILL |
| dame | DAME | TAME | GAME | FAME |
| gall | GALL | CALL | BALL | FALL |
The onset sound of all target words was a stop consonant, among which half were voiced and the other half voiceless stops. The three places of articulation appropriate for stops in the English language (i.e., bilabial, alveolar, and velar) were all represented for both voiced and voiceless onsets. Real words were chosen over pseudo-words because reading pseudo-words can be difficult for people with phonological impairments and stop consonants were avoided in the coda position to avoid potential interference from phonetic similarity within the word from the similarity between the onset and the coda.
Each target word was paired with a prime word to form the four conditions of this experiment in which the phonetic similarity between the prime and target was manipulated, as shown in Fig. 1. The prime-target pairs shared the rime in each condition. In the Identical condition the prime was the same word as the target (e.g., BILL-bill). In the three remaining conditions, the target and the prime differed in the initial consonant. In the Similar Place and Manner condition (from here forward Similar Place-Manner) the onsets of the word pair differed only in the voicing feature (e.g., PILL-bill) while in Similar Voicing and Manner (from here forward Similar Voice-Manner) the prime and target differed only in the place of articulation (e.g., DILL-bill). Finally, in the Different condition, initial consonants did not share any phonetic features (e.g., FILL-bill). The primes in each condition were matched for relevant psycholinguistic variables, such as syllable frequency, word frequency, orthographic and phonemic neighborhood density, neighbor frequency, and bigram and biphone frequency. These properties of the materials are summarized in Table 3.
Table 3.
Summary of the psycholinguistic properties of the second word in each condition; the first word is identical across all conditions.
| Identical |
Similar Place-Manner |
Similar Voice-Manner |
Different |
|||||
|---|---|---|---|---|---|---|---|---|
| M | SD | M | SD | M | SD | M | SD | |
| Syll freqa | 1.23 | 0.75 | 1.59 | 0.70 | 1.85 | 0.80 | 1.84 | 0.44 |
| CELEX logb | 0.86 | 0.65 | 1.54 | 0.67 | 1.22 | 0.81 | 1.61 | 0.36 |
| SLBFc | 9.69 | 0.31 | 9.73 | 0.47 | 9.57 | 0.68 | 9.73 | 0.66 |
| MLBFd | 3.23 | 0.10 | 3.24 | 0.16 | 3.19 | 0.23 | 3.24 | 0.22 |
| SLBPFe | 5.41 | 0.77 | 5.56 | 0.52 | 5.69 | 0.47 | 5.86 | 0.58 |
| MLBPFf | 2.70 | 0.39 | 2.78 | 0.26 | 2.84 | 0.24 | 2.93 | 0.29 |
| Ng | 15.66 | 1.97 | 12.66 | 2.73 | 13.66 | 3.61 | 12.33 | 1.63 |
| PNh | 27.66 | 5.85 | 26.50 | 7.23 | 27.00 | 4.81 | 29.33 | 5.20 |
| Freq Ni | 87.73 | 49.36 | 120.00 | 134.76 | 78.76 | 72.66 | 103.61 | 74.10 |
Log Syllable frequency regardless of word position and (Baayen etal., 1995).
log total CELEX word frequency (Baayen et al., 1995).
summed log bigram frequency (Davis, 2005).
mean log bigram frequency (Davis, 2005).
summed log biphone frequency (Davis, 2005).
mean log biphone frequency (Davis, 2005).
orthographic neighborhood size (Davis, 2005).
phonological neighborhood (Davis, 2005).
frequency of orthographic neighbors (Davis, 2005).
In addition to the experimental conditions, the experiment also included fillers which mimicked the identical condition except prime words rather than target words were presented as both primes and targets. Fillers served a twofold purpose: like the trials in the identical condition, they helped set up the expectation that the prime will be the same word as the target since most of the trials (75%) in the experiment followed this sequence of events. In addition, the fillers made it impossible to learn over the course of the experiment which prime words are occasionally followed by a target that is different from the prime, because all prime words were sometimes followed by both a target that was identical to the prime and a target that differed from the prime.
The experiment consisted of 288 trials that were divided into 12 blocks of 24 trials. In each block, participants saw six trials from the Identical condition, two trials from the Similar place/manner, Similar voice/manner, and Different conditions, and 12 filler trials. All unique prime-target pairs were therefore presented within a run of three blocks in a random order; the unique prime target pairs in the Identical condition were all presented once within each block. Trials within each block were distributed in pseudorandom order with the constraints that the first two trials of every block were fillers and consecutive presentations of the same target were avoided. Each experimental prime target pair was presented four times throughout the experiment dividing the experiment into four runs of three blocks each.
2.4. Equipment
The experiment was programmed in E-Prime Software (Version 2; Psychology Software Tools, Inc., Sharpsburg, PA) and run on a Dell Inspiron 530 computer with a 21.5 in. LCD screen. The experimenter used a button box (Serial Response Box; Psychology Software Tools, Inc.) for on-line accuracy judgements and advancement of experimental events (e.g., trials). An M-Audio Aries condenser microphone (M-Audio, Cumberland, RI) placed on a desk stand approximately 30 cm from the participants’ mouth recorded the speech responses at 44.1 kHz onto one channel via a Marantz CDR-420 CD recorder (Marantz America LLC, Mahwah, NJ). The other channel received the input directly from the computer and recorded signals (beeps) that were presented simultaneously with the target onset; these beeps were inaudible to the participants but they were necessary for measuring RT from the acoustic record.
2.5. Analysis
The dependent variables were reaction time (RT) of correct responses (see below for details and exceptions) and error rates. Error rates will be considered first. The reprogramming paradigm can produce two types of incorrect productions that are of interest. First is a general category of speech errors that includes all target attempts that are not correct productions (for example, fin instead of bill). The second error type is a more specific category which provides direct evidence for the idea that the program for the prime word competed for selection with the program for the target word. This category will be referred to as intrusion errors from here forth and it includes productions where the participant said the prime or part of the prime instead of the target (e.g., pill or pi-bill for a trial where the prime is PILL and target bill). Hence, intrusion errors are a subclass of speech errors. To assess the reliability of speech error coding, an independent rater judged two blocks of trials for 16 participants with AOS and/or aphasia. Results indicated high agreement between raters (speech errors: 96.9% and intrusion errors: 98.2%). In addition to speech errors, two more types of responses were tallied and excluded: responses that preceded the go-signal – the too-early-errors (0.5% of all trials), and trials that were lost for other reasons (0.9% of all trials), e.g. inattention at the time of the go-signal, background noise, failures to respond. While there were very few too-early-errors in this study, they were most common in the aphasia group (1%) and least common in the AOS group (0.09%) with the control group in between (0.5%).
The primary measure of interest was RT – the duration between the target onset (which co-occurred with the presentation of a tone not audible for participants) and the release burst of the onset consonant of the target. The release burst was identified by simultaneous inspection of the waveform (sudden increase in amplitude that is continuous with the rest of the signal for the target word) and the spectrogram (sudden increase in amplitude that is continuous with the rest of the signal for the target word and spans the visible frequency range of 0–10,000 Hz). The visible time window for analysis was set to 1500 ms. All RTs were measured manually by the first author using the T32 program (Milenkovic, 2010). A second rater remeasured 11% of the data including data from all participant groups to establish inter-rater reliability. The intraclass correlation (Shrout and Fleiss, 1979) established high inter-rater reliability for RT measures: ICC (2,1) = 0.99; the average difference between raters was 0.22 ms.
RTs were measured for correct responses as well as responses with distortions of speech sounds (57 trials), where the target sound was clearly recognizable. Inclusion of distortions was deemed justified in these cases because the response suggests that the participant had activated the appropriate motor program for the target and that distortions are comparable to correctly produced responses in that regard. In total, 10% of the data (605 trials) were regarded erroneous and were excluded from the RT analysis. In addition, all RTs with absolute values of less than 300 ms were removed as outliers (17 observations, 0.3% of the data).
Errors were analyzed statistically with Generalized Linear Mixed Models (Jaeger, 2008) in R, version 3.3.2 “Sincere Pumpkin Patch” (R Core Team, 2016) with packages lme4, version 1.1–12 (Bates et al., 2016) and lmerTest, version 2.0–33 (Kuznetsova et al., 2016). RTs were analyzed with Linear Mixed Effects Modelling (Baayen et al., 2008) implemented within the same software.
3. Results
3.1. Error Analysis
Separate mixed logistic regression models were applied to trial level data for both dependent variables (all speech errors and intrusion errors) where Group, Condition,5 and Group × Condition interaction served as fixed effects, and intercepts for Subjects and Items served as random effects (glmer (Error ~ Group * Condition + (1|Subject) + (1|Item)). However, the models with the interaction term failed to converge and therefore two models (one for each type of error) were first constructed to examine the group differences (glmer (Error ~ Group + (1|Subject) + (1|Item)). Next, separate models were constructed for every Group with Condition as the only fixed effect (glmer (Error ~ Condition + (1|Subject) + (1|Item)). The reference category was changed for every model to yield comparisons between all possible pairs of conditions and Groups.
3.1.1. All speech errors
The results for all speech errors by condition and group are presented in Fig. 2. The Control group produced significantly fewer errors overall compared to those with AOS (z = 5.03, p < 0.001 and Aphasia only (z = 3.89, p < 0.001), but the patient groups did not differ from one another (z = −1.09, p > 0.05). In the control group, all switch conditions yielded significantly greater number of errors than the Identical condition (Similar Place-Manner: z = 6.83, p < 0.001; Similar Voice-Manner: z = 4.07, p < 0.001; and Different: z = 4.45, p < 0.001). In addition, there were more errors in Similar Place-Manner condition compared to Different (z = 2.08, p < 0.05) and Similar Voice-Manner (z = −2.36, p < 0.05). Similarly to the Control group all switch conditions yielded more errors than the Identical condition in the Aphasia group (Similar Place-Manner: z = 4.63, p < 0.001; Similar Voice-Manner: z = 4.13, p < 0.001; and Different: z = 4.30, p < 0.001) but no other comparisons were statistically significant in this group. In the AOS group, two switch conditions differed significantly from the Identical condition (Similar Place-Manner: z = 5.01, p < 0.001; and Different: z = 4.68, p < 0.001) while Similar Voice-Manner condition did not yield more errors than the Identical condition. The Similar Voice-Manner condition had also fewer errors than the Different condition (z = −2.81, p < 0.01) and the Similar Place-Manner condition (z = −3.07, p < 0.01). The Different condition did not differ from the Similar Place-Manner condition.
Fig. 2.
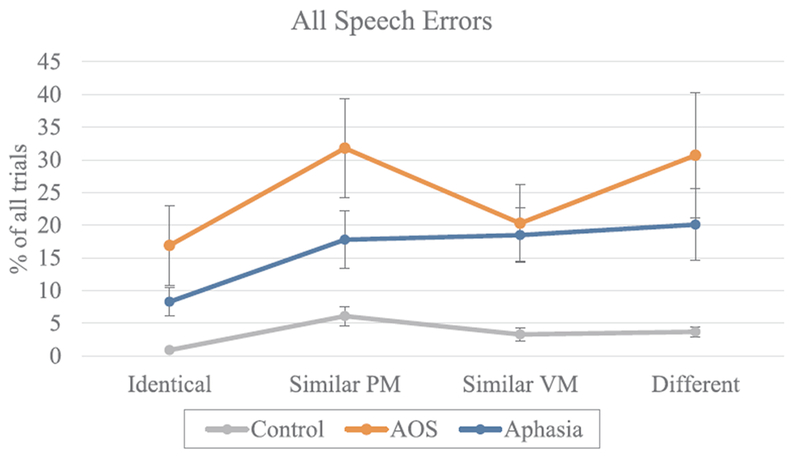
The proportion of trials with speech errors across conditions. Error bars represent the standard error. (PM = place and manner; VM = voicing and manner).
3.1.2. Intrusion errors
As mentioned earlier, a clear effect of the experimental manipulation is manifested in the intrusion errors because they provide direct evidence of the interference from the primes: primes were prepared for production, maintained until the go-signal, and indeed sometimes even produced instead of the target. Intrusion errors are represented in Fig. 3. In parallel with the results of the overall speech errors, both patient groups differed from the Control group (AOS: z = 2.05, p < 0.05; Aphasia: z = 2.10, p < 0.05) but did not differ from one another (z = −0.04, p > 0.05) in terms of the number of intrusion errors. The control group produced significantly more intrusion errors in the Similar Place-Manner condition compared to the Similar Voice-Manner condition (z = −2.57, p < 0.01) and compared to the Different condition (z = −2.94, p < 0.01). In the aphasia group, there were no significant differences between conditions. The AOS group produced similar intrusion error patterns to the control group except in the context of numerically even larger differences between the Similar Place-Manner condition and other conditions (Similar Voice-Manner: z = −3.25, p < 0.01; and Different: z = −3.25, p < 0.01).
Fig. 3.
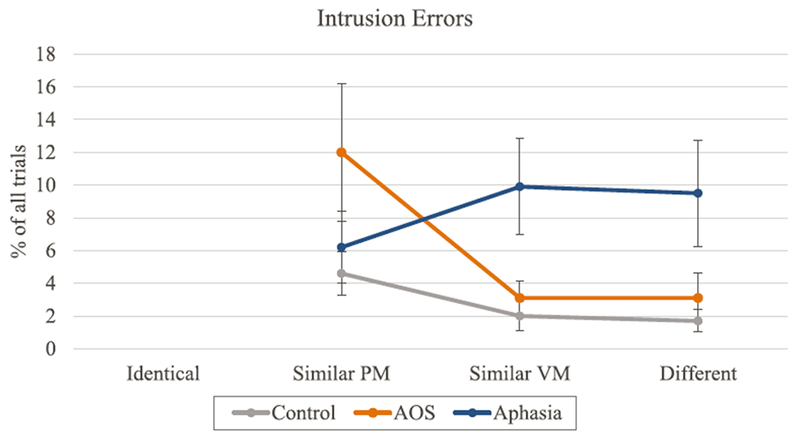
The proportion of trials with intrusion errors across conditions. Error bars represent the standard error (PM = place and manner; VM = voicing and manner).
3.2. Reaction times
3.2.1. Group data
Mean RT by group and condition are presented in Fig. 4. RT data were analyzed using a linear mixed effects model where RT was predicted by Condition, Group, and Condition by Group interaction as fixed effects. In addition, to control for potential fatigue or practice effects as well as for the variable delay between the button press (indicating readiness to respond) and the target onset, Run and Variable Delays were also included as fixed effects. By-subject random slopes and the intercepts for items were included as random effects. The final formula for the model was as follows: RT ~ Condition * Group + Run + Variable Delay + (1 + Condition|Subject) + (1|Target). Residuals were visually inspected for homoscedasticity of variance across the fitted values. To assess the normality of the residuals, skewness and kurtosis were calculated (skewness = 3.41; kurtosis = 34.60). The high values of skewness and kurtosis call for a data transformation, such as log-transformation or reciprocal transformation, to be considered. However, such treatment is unwarranted for the present dataset for three major reasons. First, it is clear from Fig. 4 that the RTs are overall considerably longer for the AOS group compared to the other two groups. This means that the data for the AOS group would be affected proportionally more by the transformations than the data for the other groups. Hence, by transforming the data, we would risk masking the primary effect of interest. Second, linear mixed effects models are considered robust to the effect of minor deviations from normality (Gelman and Hill, 2007). Third, log or reciprocal transformations would be warranted if there is a relationship between the difference of interest between conditions and the overall RT in the control group data (Salthouse and Hedden, 2002). Such a relationship is absent in the control group data for the present study: correlation between the reaction time in the Identical condition and the switch cost was close to zero (r = −0.11, p > 0.05). With these considerations, the statistical analysis was performed on unaltered RT values.
Fig. 4.
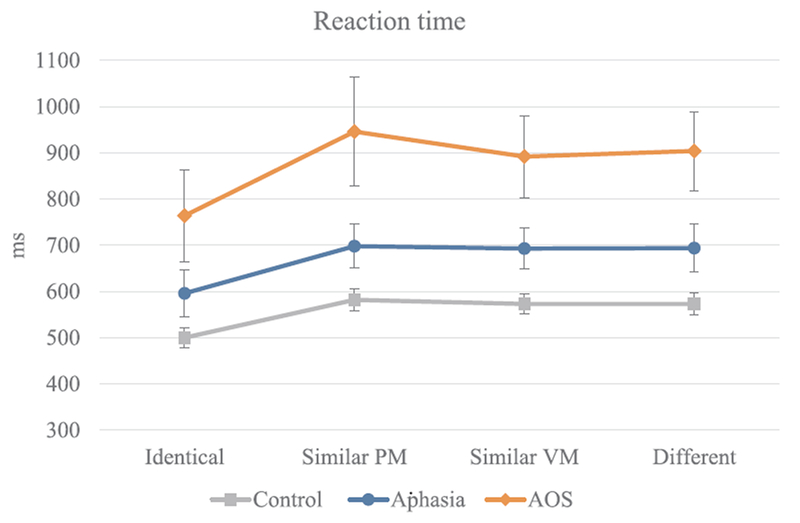
Mean RT by group and condition. Error bars represent standard error. (PM = place and manner; VM = voicing and manner).
The statistical model yielded a significant effect of Group on overall RT. More specifically, in comparison to the Control group, overall RTs were slower in the Aphasia group (t = 2.50, p < 0.05) and in the AOS group (t = 6.40, p < 0.001); the latter two groups differed as well (t = −3.35, p < 0.01). There was also a significant effect of Condition. Namely, RTs in all switch conditions were significantly longer compared to the Identical condition (Similar Place-Manner: t = 8.56, p < 0.001, Similar Voice-Manner: t = 8.06, p < 0.001, Different: t = 7.79, p < 0.001). Most importantly, the two-way interaction between Group and Condition was also significant. Compared to the Control group, the differences between the Identical condition and all switch conditions were larger for the AOS group (comparison with Similar Place-Manner: t = 5.82, p < 0.001, Similar Voice-Manner: t = 3.63, p < 0.001, and Different: t = 4.89, p < 0.001). The Aphasia group did not differ in magnitude of the switch cost from the controls (t ≤ 1.12, p > 0.05 for all comparisons with the Identical condition) but did differ from the AOS group (comparison with Similar Place-Manner: t = −4.39, p < 0.001, Similar Voice-Manner: t = −2.13, p < 0.05, and Different: t = −3.35, p < 0.001). Finally, Run and Variable Delay also affected the RTs. With the first run as the reference category, the second run had significantly shorter RTs (t = −6.89, p < 0.001) and so did the third (t = −11.31, p < .001) and fourth run (t = −12.16, p < 0.001); longer delays between button press and target onset (The Variable Delays factor) were associated with shorter RTs (t = −4.60, p < 0.001).
To test the differences between the two Similar conditions compared to the Different condition, we ran the same model again with the Different condition rather than the Identical condition as the reference category. Neither Similar Place-Manner nor Similar Voice-Manner differed significantly from the Different condition.
3.2.2. Data for individual participants
The Bayesian Standardized Difference Test (Crawford et al., 2010) was used to test whether the observed group-level differences held for individual speakers. This method provides a means for evaluating a difference between two tasks (in this case two experimental conditions) in an individual participant in comparison to the same difference in the control group. The difference between the Identical condition and the three switch conditions were tested separately for each speaker in the AOS group and the Aphasia group; results are summarized in Tables 4 and 5, and the Control data is available in Appendix. Overall, the individual data support the group-level results. Six of the eight speakers with AOS demonstrated a significantly larger switch cost in at least one switch condition compared to the control group. For illustrative purposes, the average switch cost for every speaker is represented graphically in Fig. 5.
Table 4.
RT means (in milliseconds) and switch cost values (in milliseconds) in different target-prime conditions for individual patients; Ident = Identical, Sim PM = Similar Place-Manner, Sim VM = Similar Voice-Manner, Diff=Different
| Condition means |
Switch Costs |
||||||
|---|---|---|---|---|---|---|---|
| Partic. ID | Ident | Sim PM | Sim VM | Diff | Sim PM | Sim VM | Diff |
| AOS 001 | 951 | 1094 | 984 | 1022 | 143 | 33 | 71 |
| AOS 002 | 997 | 1215 | 1266 | 1219 | 218 | 269 | 221 |
| AOS 003 | 687 | 755 | 800 | 878 | 67 | 112 | 190 |
| AOS 004 | 494 | 566 | 550 | 560 | 72 | 55 | 65 |
| AOS 005 | 802 | 1062 | 1048 | 1040 | 260 | 246 | 238 |
| AOS 006 | 739 | 897 | 884 | 915 | 159 | 145 | 177 |
| AOS 007 | 659 | 989 | 871 | 985 | 330 | 212 | 326 |
| AOS 008 | 759 | 1043 | 841 | 846 | 284 | 81 | 86 |
| APH 001 | 510 | 584 | 628 | 582 | 74 | 118 | 72 |
| APH 002 | 787 | 856 | 846 | 910 | 69 | 59 | 123 |
| APH 003 | 563 | 645 | 660 | 668 | 82 | 97 | 105 |
| APH 004 | 495 | 545 | 605 | 605 | 50 | 110 | 110 |
| APH 005 | 606 | 725 | 715 | 656 | 119 | 109 | 50 |
| APH 006 | 505 | 642 | 575 | 568 | 137 | 71 | 64 |
| APH 007 | 624 | 692 | 686 | 728 | 68 | 62 | 104 |
| APH 008 | 568 | 671 | 682 | 651 | 103 | 114 | 83 |
| APH 009 | 716 | 852 | 840 | 843 | 137 | 124 | 128 |
Table 5.
Bayesian Standardized Difference Test results for individual patients’ RT; p-values are reported for a 1-tailed test; significant effects are bolded, trends (p < 0.01) italicized.
| Identical vs Different | Identical vs. Similar Place-Manner | Identical vs. Similar Voice-Manner | |
|---|---|---|---|
| AOS 001 | |||
| p | 0.30 | 0.34 | 0.33 |
| Z-DCC | −0.65 | 0.52 | 0.55 |
| 95% CI | −2.34 to 1.02 | −1.05 to 2.11 | −1.02 to 2.15 |
| AOS 002 | |||
| p | 0.07 | 0.00 | 0.03 |
| Z-DCC | −2.07 | −4.66 | −2.59 |
| 95% CI | −4.14 to −0.08 | −7.26 to −2.22 | −4.73 to −0.52 |
| AOS 003 | |||
| p | 0.31 | 0.17 | 0.02 |
| Z-DCC | 0.50 | −1.01 | −2.28 |
| 95% CI | −0.22 to 1.25 | −1.91 to −0.15 | −3.44 to −1.20 |
| AOS 004 | |||
| p | 0.42 | 0.35 | 0.44 |
| Z-DCC | 0.19 | 0.37 | 0.14 |
| 95% CI | −0.20 to 0.58 | −0.03 to 0.78 | −0.25 to 0.53 |
| AOS 005 | |||
| p | 0.00 | 0.00 | 0.00 |
| Z-DCC | −3.15 | −4.01 | −3.15 |
| 95% CI | −4.83 to −1.57 | −5.90 to −2.25 | −4.82 to −1.58 |
| AOS 006 | |||
| p | 0.14 | 0.06 | 0.049 |
| Z-DCC | −1.20 | −1.75 | −1.91 |
| 95% CI | −2.29 to −0.16 | −2.94 to −0.62 | −3.12 to −0.75 |
| AOS 007 | |||
| p | 0.00 | 0.00 | 0.00 |
| Z-DCC | −4.71 | −3.15 | −5.18 |
| 95% CI | −6.47 to −3.12 | −4.47 to −1.94 | −7.06 to −3.48 |
| AOS 008 | |||
| p | 0.48 | 0.00 | 0.37 |
| Z-DCC | −0.05 | −3.68 | −0.36 |
| 95% CI | −1.04 to 0.94 | −5.38 to −2.11 | −1.38 to 0.65 |
| APH 001 | |||
| p | 0.43 | 0.16 | 0.48 |
| Z-DCC | 0.17 | −0.99 | 0.03 |
| 95% CI | −0.22 to 0.56 | −1.49 to −0.51 | −0.36 to 0.42 |
| APH 002 | |||
| p | 0.29 | 0.47 | 0.26 |
| Z-DCC | 0.61 | 0.08 | −0.73 |
| 95% CI | −0.41 to 1.66 | −0.98 to 1.15 | −1.89 to 0.40 |
| APH 003 | |||
| p | 0.46 | 0.28 | 0.27 |
| Z-DCC | 0.07 | −0.57 | −0.60 |
| 95% CI | −0.36 to 0.52 | −1.08 to −0.08 | −1.11 to −0.11 |
| APH 004 | |||
| p | 0.26 | 0.21 | 0.21 |
| Z-DCC | 0.62 | −0.80 | −0.79 |
| 95% CI | 0.20 to 1.07 | −1.26 to −0.36 | −1.25 to −0.34 |
| APH 005 | |||
| p | 0.28 | 0.20 | 0.27 |
| Z-DCC | −0.60 | −0.86 | 0.60 |
| 95% CI | −1.20 to −0.01 | −1.51 to −0.24 | 0.08 to 1.15 |
| APH 006 | |||
| p | 0.14 | 0.47 | 0.41 |
| Z-DCC | −1.08 | 0.06 | 0.21 |
| 95% CI | −1.60 to −0.59 | −0.33to 0.45 | −0.17 to 0.61 |
| APH 007 | |||
| p | 0.33 | 0.44 | 0.30 |
| Z-DCC | 0.43 | 0.14 | −0.51 |
| 95% CI | −0.13 to 1.00 | −0.43 to 0.72 | −1.15 to 0.10 |
| APH 008 | |||
| p | 0.37 | 0.17 | 0.44 |
| Z-DCC | −0.33 | −0.94 | −0.13 |
| 95% CI | −0.81 to 0.14 | −1.53 to −0.39 | −0.60 to 0.32 |
| APH 009 | |||
| p | 0.23 | 0.12 | 0.20 |
| Z-DCC | −0.80 | −1.28 | −0.89 |
| 95% CI | −1.74 to 0.12 | −2.31 to −0.29 | −1.85 to 0.03 |
Fig. 5.
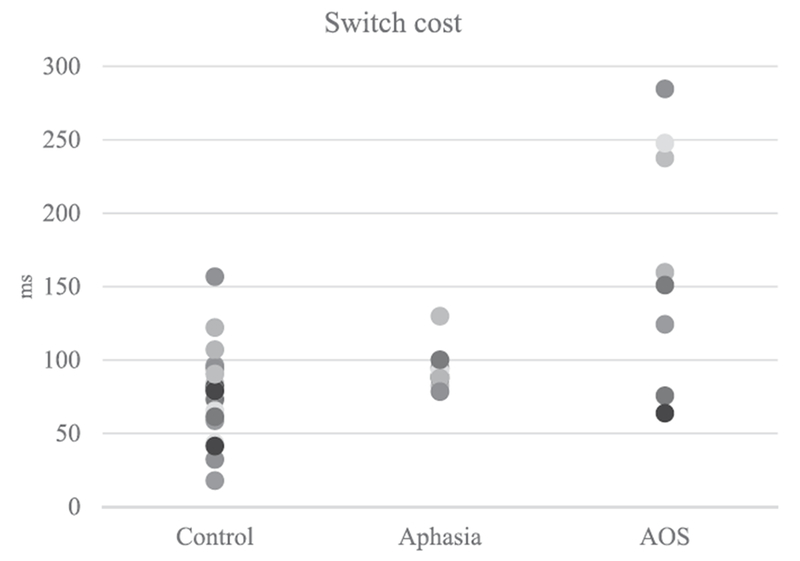
Switch cost (the difference between identical condition and all other conditions) for individual speakers. Switch costs by condition and participant are numerically presented in Table 4.
In contrast to the speakers in the AOS group, none of the speakers in the Aphasia group differed significantly from the control group in terms of the switch cost regardless of the specific switch condition.
4. Discussion
This study was designed to examine the speech motor planning impairment in AOS. More specifically, two hypotheses were identified from the AOS literature, conceptualized in a current model of speech production, and tested in a reaction time paradigm that occasionally required rapid switching between phonetically similar words. The purpose of the study was two-fold: to specify the nature of the speech motor planning impairment in AOS with regard to the hypotheses and to test the specificity of this impairment to AOS.
The results from the control speakers provide the foundation for interpreting the data from speakers with AOS and/or aphasia and therefore serve as a starting point for this discussion. The control group demonstrated more errors and a significantly longer reaction time in the switch conditions where the prime and target did not match, compared to identical prime-target pairs. These results replicate previous findings (Jones et al., 2010; Meyer and Gordon, 1985; Spencer and Rogers, 2005; Spencer and Wiley, 2008; Yaniv et al., 1990), and suggest that the basic manipulation of this experiment was effective. This finding also supports the view that speakers prepared the response in advance and did not simply say the target word without preparation. It was somewhat surprising that there was no significant RT difference between the Different condition and the Similar conditions as found by others (Meyer and Gordon, 1985; Rogers and Storkel, 1998); possible explanations will be considered later in the discussion.
4.1. The underlying impairment in AOS
The switch-cost observed in the control data was evident also for speakers with AOS and for those with aphasia. More importantly, the switch-cost in the AOS group was greater in magnitude compared to the Control group and the Aphasia group. This pattern, predicted by the Program Retrieval Deficit Hypothesis, lends support to the idea that people with AOS have difficulty activating the intended motor program particularly in the context of competing alternatives. These results are consistent with findings from Mailend and Maas (2013) where speakers with AOS also showed disproportionally long reaction times in the context where competing motor programs were activated via an auditory distracter. Taken together, these results provide converging evidence that access to the speech motor programs is part of the speech motor planning impairment at least in some individuals with AOS.
The RT findings from the AOS group are not consistent with the idea of a reduced buffer capacity which limits the speakers’ ability to plan more than one motor program at a time, because the paradigm used in this study only required the planning and holding of one item at a time. Deger and Ziegler (2002) also argued against the possibility of a reduced buffer capacity based on their finding that speakers with AOS take longer to initiate a sequence of two different syllables (e.g., da-ba) compared to a sequence of two identical syllables (da-da). According to their analysis, a reduced buffer capacity cannot explain these results because the syllable that is loaded to the buffer first is identical in both cases. Nevertheless, because the Reduced Buffer Capacity Hypothesis predicted null findings in the current study as well as the study by Deger and Ziegler, some caution is warranted in rejecting the hypothesis based on these data alone.
The overall slower RTs in the AOS group are also in line with the Program Retrieval Deficit Hypothesis. This finding suggests that reading out motor programs may be difficult for some speakers with AOS even without competing activation from alternative motor programs; the Reduced Buffer Capacity Hypothesis makes no such prediction and would have to assume some additional impairment to account for the overall slowed RT. In terms of the DIVA/GODIVA model, selecting the intended motor program requires reaching a certain activation level for the program’s representation (Civier et al., 2013).
It is possible that, at least in some speakers with AOS, accumulating the necessary activation requires more time than in typical speakers and that is what is reflected in the slower RT in the Identical condition for speakers with AOS. The observed switch cost in people with AOS clearly demonstrates that these speakers did prepare the prime for production, but whether the difference in reaction time between the identical and other conditions comes from the benefit of knowing the target in advance (allowing more time to accrue the necessary activation level for selection) or from the interference from a competing motor program activated by the prime cannot be determined from these data alone, particularly in light of the overall slower reaction time observed in the data of several speakers with AOS.
An alternative explanation for the overall slow reaction time is slow accrual of phonological activation in the speakers with AOS (Maas et al., 2014; Rogers et al., 1999). It is possible that the impairment in AOS slows the processing in several speech production stages independently, or, as discussed by Maas and colleagues, the seemingly slow accrual of phonological information may be caused by a slowdown in the subsequent stage in speech production – the speech motor planning stage – which is effectively creating a bottleneck for the flow of activation between these two stages. Finally, because the speech motor programs are activated by the representations at the phonological level, it is also possible that the problem at the speech motor planning level really has its roots in the input to the speech motor planning stage. The RT in the Identical condition was not slower for all speakers, however, and the reader is referred to the discussion on individual RT patterns below.
The error data for the AOS group is consistent with the RT time data, arguing against the possibility of speed-accuracy tradeoffs. Speakers with AOS committed the largest number of speech errors in the Similar PM condition where they also exhibited the longest RTs, and the smallest number of errors in the Similar VM condition where the RTs were shortest amongst the switch conditions for this group. But the most striking pattern was observed in the intrusion errors which are of particular interest in the context of this study. While the source of other speech errors is impossible to pinpoint, intrusion errors reflect unsuccessful resolution of the competing activations between the prime and the target. In that light, it is striking that the intrusion error pattern for the AOS group mimics that of the control group, except that the effect, much like the switch-cost effect in RTs, is times greater in magnitude. More precisely, speakers with AOS had the largest intrusion error rate in the Similar PM condition, once again suggesting that the speech motor planning operations are most affected by the competition from programs that share all but the voicing feature of the onset consonant. In sum, the intrusion error analysis perfectly complements the exaggerated switch cost in the RT analysis and thereby provides further support to the Program Retrieval Deficit Hypothesis.
The analysis of the individual speakers aligned with the primary analysis of group RTs. Six of the eight speakers with AOS showed a significantly larger switch-cost than the control group in at least one condition. Two speakers (AOS 001 and AOS 004), however, did not differ from the control group in the switch-cost measure. Despite this similarity in the switch cost, these individuals differed from one another considerably in terms of background variables as well as overall RT. For AOS 004, the typical switch cost occurred in the context of RT that was similar to the control group in the Identical condition. AOS 004 had a mild AOS, suggesting that perhaps the task may not be sensitive to mild impairments or that his AOS is characterized by a different underlying speech motor planning impairment. As speech motor planning involves a complex set of processes, it is not unreasonable to assume that different components of this speech motor planning system can be impaired (see Maas et al., 2015 for discussion of subtypes). AOS 001, in contrast, had a moderate-severe AOS and considerably slower RT in the Identical condition (more than twice as long as the average RT for that condition in the control group). It is possible that long overall RT in the Identical condition signifies a different, or additional problem of speech motor planning that masked any switch-cost effects.
It must be stated that the discussion of the individual-level data is speculative. This is highlighted by the fact that for both cases that differed from the group pattern, a counter case can be found that followed the group pattern despite similar background variables. For example, AOS 007 had a mild AOS with RT close to normal within the Identical condition, much like AOS 004, yet he showed a switch cost more than twice that observed in the control group. AOS 002 had a moderate AOS and long RT in the Identical condition much like AOS 001, but unlike AOS 001, demonstrated switch costs more than twice as long as the control group. AOS 001 and AOS 002 differed significantly in age which may have also influenced their performance in this task.
In sum, all the major sources of evidence in this study (group-level RT pattern, RT pattern at the level of the individual for most speakers, and intrusion error data) are in line with, and predicted by, the Program Retrieval Deficit Hypothesis. Furthermore, other hypotheses in the literature cannot account for these data without making additional assumptions. The possibility remains that the alternative hypotheses account for some aspects of the impairment in AOS, but the findings from this study and from Mailend and Maas (2013) together provide strong evidence that they are at least incomplete.
4.2. The specificity of the speech motor planning impairment
Our second aim was to test whether the speech motor planning impairment is specific to AOS. In other words, our task detected an impairment in the AOS group by producing RT patterns that were different from the control group. Furthermore, the RT patterns differed from the control group in a way that was predicted by the Program Retrieval Deficit Hypothesis. But this alone does not warrant the claim that the detected deficit is at the core of the apraxic impairment. After all, most of the speakers in the AOS group also had aphasia and all of them had brain damage. To relate the second aim to the present results, the discussion will now focus on the performance of the aphasia group.
The aphasia group showed a switch cost comparable to the control group at the group level as well as at the level of the individual: none of the speakers in the Aphasia group differed significantly from the control group in terms of the switch cost regardless of the specific switch condition or overall reaction time. This finding indicates that the exaggerated switch cost is specific to the AOS group in this study, consistent with the notion that the detected speech motor planning impairment is specific to AOS.
In terms of errors, the aphasia group resembled the AOS group in the overall rate of errors but the pattern of errors by conditions, particularly for intrusion errors, looked much different for the aphasia group. While the Control and the AOS group had a significantly larger error rate in the Similar PM condition compared to other switch conditions, there were no significant differences between the switch conditions in the aphasia group. This may suggest a different cognitive mechanism as the source of intrusion errors in this group. For example, some of the intrusion errors in the aphasia group may have resulted from difficulty with waiting for the go-signal. This interpretation is supported by the fact that the too-early-responses were twice as common in the aphasia group compared to the control group and 10 times more common compared to the AOS group and may point to a more general attention or inhibition difficulty in these speakers (see also Maas et al., 2008). Taken together, these findings are consistent with the notion that the pattern observed for the AOS group reflects speech motor planning impairment, and that this impairment is specific to AOS and not to aphasia or brain damage more generally.
The differential performance between the aphasia and the AOS group also provides further support for the interpretation that the reprogramming paradigm used in this study taps into the speech motor planning operations. The task requires that participants plan the target word in switch conditions during the RT, and therefore, an alternative possibility could be that the increased RTs in the AOS group speaks to difficulties with phonological planning rather than difficulties with speech motor planning. The differential performance between the AOS and the aphasia group undermines this possibility but only if there was an opportunity to observe phonological difficulties in the Aphasia group of this study. Similar performance on the repetition section of the WAB between the AOS and the Aphasia group suggests comparable production difficulties in both groups. But in order to quantify phonemic paraphasias more specifically, errors that involved the substitution, addition, or deletion of a single phoneme in the experimental task were tallied for both groups. No statistical differences in average single phoneme error rates were found between the groups (t = 1.09; p < 0.05). Furthermore, there was no correlation between the switch cost and the repetitions subsection of the WAB (r = 0.18, p > 0.05) or the single phoneme errors in the experiment (r = −0.05, p > 0.05). With these considerations, it is unlikely that including more participants with a more pronounced phonological impairment in the Aphasia group would have altered the findings of this study and the parsimonious explanation is that this task did indeed tap into the speech motor planning phase in speech production.
4.3. The phonetic similarity effect
As mentioned earlier, it was somewhat surprising that there was no significant RT difference between the Different condition and the Similar conditions as found by others (Meyer and Gordon, 1985; Rogers and Storkel, 1998). This observation may have several possible reasons.
First, unlike previous studies, a different font type between the PRIME and the target was used to break up the visual continuity between the two. It is possible that part of the similarity effect in earlier studies is attributable to visual similarity. Some sounds that share articulatory features are represented with graphemes that also share visual features and are therefore more difficult to visually tell apart. Compare, for example, ‘b’ and ‘d’ to ‘b’ and ‘s’ or ‘b’ and ‘f’.
Second, it is possible that the phonetic similarity effect changes with age. Our control group was age-matched to our patient groups and thereby were considerably older than the college-age participants in previous studies (e.g., Meyer and Gordon, 1985; Rogers and Storkel, 1998). Older adults show larger switch costs in other cognitive domains (e.g., task switching; Hirsch et al., 2016) and by analogy it is possible that also switching between similar words also shows age-related differences.
Third, it is possible that the self-select modification to the reprogramming paradigm, which allowed the participants to study the primes for as long as they needed to, affected the phonetic similarity effect. Spencer and Wiley (2008) studied the effect of inter-stimulus interval (duration between prime onset and target onset) on reprogramming operations and found that the switch-cost was larger at shorter inter-stimulus intervals. They further argued that the neural activation for the prime word is strongest at shorter inter-stimulus intervals which renders the competition from the prime also the strongest at short durations between the prime and target presentations. To make sure that the speakers with AOS and/or aphasia had enough time to prepare the response, the task was modified by allowing participants to study the prime until they themselves determined that they are ready to respond (the self-select paradigm; Maas et al., 2008). This modification extended the duration between the prime and target presentations beyond the variable delay period that was under the experimental control. The extended delay, in turn, may have contributed to the decay of the prime activation, making it more difficult to detect small effects of the reprogramming operations such as the phonetic similarity effect.
Finally, the last possibility is that the Different condition was not different enough to observe interference from similar programs at the level of speech motor planning. As discussed earlier, syllable is a likely candidate for the unit of motor programming. In all of the experimental conditions, the prime and the target shared the rime; thus, the similarity at the level of the syllable was significant in all conditions. It is an interesting question for future research to address whether interference from similarity would be observed if the similarity is manipulated at the level of the entire syllable rather than at a single position within the syllable as in the current study.
4.4. Relations between switch cost and working memory
All participants in both patient groups performed below the control group mean on the short-term and working memory measures (except AOS 004 on Forward Span) but the AOS group did not differ from the Aphasia group on either the Forward or Backward Picture Span. Worse performance on the working memory task in these populations is consistent with previous studies that have reported working memory deficits in AOS (Hickok et al., 2014; Rochon et al., 1990; Waters et al., 1992) and the numerous studies that have reported working memory deficits in aphasia (e.g., Caplan and Waters, 1995; DeDe et al., 2014; Mayer and Murray, 2012; Minkina et al., 2017). The difference between the patient groups on the experimental task and the lack of difference on the working memory task suggests that the results of the current experiment are not driven by a short-term memory or working memory impairment. Furthermore, there was no correlation between the average switch cost and the highest span in forward and backward recall (r = −0.20, p > 0.05 and r = −0.25, p > 0.05 respectively). The opposite, however, remains a possibility: speech motor planning buffer impairments could explain short-term memory or verbal working memory impairments in people with AOS.
Acheson and MacDonald (2009b) proposed the Language Production Hypothesis in working memory according to which we use our ability to buffer an upcoming part of an utterance within the language production system to complete a working memory task. More specifically, the classic working memory model of Baddeley and Hitch (1974) suggests that our working memory system includes a phonological store where units of speech can be held for short periods of time and the content of which can be refreshed via an articulatory loop. Recent studies have provided evidence that these working memory constructs are dependent on a language production system such that the task of refreshing the content in the phonological store via the articulatory loop is in fact accomplished via sustained loops between the phonological encoding and speech motor planning (Acheson et al., 2010; Acheson and MacDonald, 2009a). If successful completion of a working memory task is dependent on the integrity of both phonological encoding operations (often impaired in aphasia) and speech motor planning operations (impaired in AOS), then it should not be surprising that working memory deficits were observed in both patient groups but speech motor planning deficits, such as the exaggerated switch-cost, only in one.
4.5. Clinical implications
Explicitly or implicitly, most speech production treatment programs are guided by an underlying assumption about the nature of the impairment that they are designed to remedy. For AOS, the largest class of treatments and most studied class of treatments (Ballard et al., 2015; Wambaugh et al., 2006) are articulatory in nature (e.g., Sound Production Treatment; Wambaugh et al., 1999). These treatments involve repeated practice of certain speech sounds or speech sound combinations that are difficult for the client. Thus, the underlying assumption of these treatments appears to be that the speech motor programs are damaged in AOS and they can be re-established via repeated and carefully guided practice. Research has shown that people with AOS make gains in this type of therapy, but the response to treatment appears to have significant individual variability and it is often hard to determine before the treatment who will benefit from it and who will not (Bailey et al., 2015).
The findings from the current study suggest that underlying impairment in AOS (at least for some speakers) involves difficulty retrieving speech motor programs and that this difficulty can be artificially increased by introducing competition between different speech motor programs. If this susceptibility to interference is a core impairment in AOS, these findings may prove useful for developing treatments for AOS that target this impairment specifically as part of a treatment hierarchy. For example, individuals with AOS who can correctly repeat individual words may benefit from training which requires rapid switching between phonetically similar words. Further investigation into the factors that increase competition for the selection of a given speech motor program may help tailor the difficulty level according to the severity of the speakers’ impairment.
The results of this study may also prove useful for designing clinical tools for differential diagnosis of AOS, since the exaggerated switch-cost appears to be specific to AOS. Acquiring data with a RT paradigm, e.g., the reprogramming paradigm used in the current study, is a time-consuming process that may not be feasible for clinical practice at present. Furthermore, not all participants with AOS and/or aphasia are able to complete this task. Nevertheless, the present findings help determine the underlying processes on which a diagnostic tool could capitalize. Currently, the program retrieval deficit appears to be a strong candidate. It is conceivable that, if supported in further studies, a clinically feasible version of this task could be developed to assess the integrity of the program retrieval process in individuals with speech production impairments. The findings from this study indicate promise for diagnostic purposes. However, the fact that two of the eight speakers with AOS did not differ significantly suggests that this task, like most other tasks and measures, is unlikely to provide perfect diagnostic accuracy and may include false negatives (though no false positives, at least in this sample).
To conclude, the combined findings from this and several previous studies provide strong evidence in support of the Program Retrieval Deficit Hypothesis, and hopefully will stimulate future research to further specify the hypothesis and to develop ways in which this knowledge may be used to further differential diagnosis and treatment of AOS.
Acknowledgements
Research reported in this publication was supported by the National Institute On Deafness And Other Communication Disorders of the National Institutes of Health under Award Number F31DC014375 and it was completed as part of the first author’s doctoral dissertation at the University of Arizona. We would like to thank Fabiane Hirsch, Lisa Jackson, Kindle Rising, Chelsea Bayley, Janet Hawley, and Andrew DeMarco for assistance with participant recruitment; and Cailey Busker and Patrice Moritz for assistance with establishing reliability. Finally, we thank our participants for volunteering their time and cooperation in support of this research.
Appendix
Individual RT means (in milliseconds) and switch cost values (in milliseconds) in different target-prime conditions for people in the Control group; Ident = Identical, Sim PM = Similar Place-Manner, Sim VM = Similar Voice-Manner, Diff = Different.
| Condition means |
Switch Costs |
||||||
|---|---|---|---|---|---|---|---|
| Partic. ID | Ident | Sim PM | Sim VM | Diff | Sim PM | Sim VM | Diff |
| CON 001 | 415 | 491 | 501 | 491 | 76 | 87 | 77 |
| CON 002 | 635 | 724 | 694 | 722 | 89 | 59 | 88 |
| CON 003 | 438 | 514 | 494 | 481 | 76 | 56 | 44 |
| CON 004 | 554 | 643 | 605 | 652 | 89 | 51 | 98 |
| CON 005 | 450 | 513 | 520 | 512 | 63 | 71 | 63 |
| CON 006 | 506 | 624 | 591 | 616 | 118 | 85 | 109 |
| CON 007 | 509 | 603 | 598 | 610 | 93 | 89 | 101 |
| CON 008 | 412 | 464 | 472 | 482 | 52 | 60 | 70 |
| CON 009 | 398 | 479 | 496 | 490 | 81 | 98 | 92 |
| CON 010 | 476 | 578 | 584 | 559 | 102 | 107 | 82 |
| CON 011 | 472 | 546 | 525 | 528 | 74 | 53 | 57 |
| CON 012 | 495 | 537 | 553 | 524 | 43 | 58 | 29 |
| CON 013 | 492 | 567 | 551 | 553 | 75 | 58 | 61 |
| CON 014 | 517 | 695 | 690 | 644 | 178 | 173 | 126 |
| CON 015 | 486 | 512 | 522 | 520 | 27 | 37 | 34 |
| CON 016 | 510 | 613 | 578 | 593 | 103 | 67 | 82 |
| CON 017 | 524 | 608 | 630 | 621 | 84 | 107 | 98 |
| CON 018 | 421 | 522 | 504 | 484 | 100 | 83 | 62 |
| CON 019 | 415 | 507 | 531 | 530 | 91 | 115 | 115 |
| CON 020 | 507 | 634 | 631 | 622 | 127 | 124 | 116 |
| CON 021 | 702 | 757 | 713 | 731 | 55 | 12 | 29 |
| CON 022 | 640 | 677 | 724 | 740 | 36 | 84 | 99 |
| CON 023 | 535 | 647 | 637 | 601 | 111 | 102 | 66 |
| CON 024 | 511 | 534 | 527 | 527 | 22 | 16 | 16 |
| CON 025 | 462 | 523 | 495 | 490 | 61 | 33 | 28 |
Footnotes
Following Guenther (2016), the term “buffer” is used here to refer to a mechanism – the temporary activation pattern – which is responsible for maintaining and selecting the intended response for the sequential process of articulation. Guenther suggested the phonological encoding buffer to be the locus of impairment for this hypothesis. We view the motor planning buffer (Speech Sound Map) to fit better as the locus in terms of the original description of the hypothesis by Rogers and Storkel and with the consensus opinion that speech motor planning rather than phonological encoding is the primary impairment in AOS. The predictions for this experiment are the same in either case because the task requires the participant to prepare and hold on to only a single syllable at a time, which by this hypothesis is within the capacity of the limited buffer at either level.
Trials in the Identical condition were removed for the model with intrusion errors as the dependent variable because intrusion errors by definition are not possible in this condition –prime and target are identical.
References
- Acheson DJ, Hamidi M, Binder JR, Postle BR, 2010. A Common neural substrate for language production and verbal working memory. J. Cogn. Neurosci 23 (6), 1358–1367. [DOI] [PMC free article] [PubMed] [Google Scholar]
- Acheson DJ, MacDonald MC, 2009a. Twisting tongues and memories: explorations of the relationship between language production and verbal working memory. J. Mem. Lang 60 (3), 329–350. [DOI] [PMC free article] [PubMed] [Google Scholar]
- Acheson DJ, MacDonald MC, 2009b. Verbal working memory and language production: common approaches to the serial ordering of verbal information. Psychol. Bull 135 (1), 50–68. [DOI] [PMC free article] [PubMed] [Google Scholar]
- Aichert I, Ziegler W, 2004. Syllable frequency and syllable structure in apraxia of speech. Brain Lang 88 (1), 148–159. [DOI] [PubMed] [Google Scholar]
- Baayen RH, Davidson DJ, Bates DM, 2008. Mixed-effects modeling with crossed random effects for subjects and items. J. Mem. Lang 59 (4), 390–412. [Google Scholar]
- Baayen RH, Piepenbrock R, Gulikers L, 1995. The Celex lexical database (Version 2) [CD-ROM]. University of Pennsylvania, Linguistic Data Consortium, Philadelphia. [Google Scholar]
- Baddeley AD, Hitch G, 1974. Working Memory In: Bower GH (Ed.), Psychology of Learning and Motivation 8 Academic Press, New York, pp. 47–89. [Google Scholar]
- Bailey DJ, Eatchel K, Wambaugh J, 2015. Sound production treatment: synthesis and quantification of outcomes. Am. J. Speech-Lang. Pathol 24 (4), S798–S814. [DOI] [PMC free article] [PubMed] [Google Scholar]
- Ballard KJ, Granier JP, Robin DA, 2000. Understanding the nature of apraxia of speech: theory, analysis, and treatment. Aphasiology 14 (10), 969–995. [Google Scholar]
- Ballard KJ, Wambaugh JL, Duffy JR, Layfield C, Maas E, Mauszycki S, McNeil MR, 2015. Treatment for acquired apraxia of speech: a systematic review of intervention research between 2004 and 2012. Am. J. Speech-Lang. Pathol 24 (2), 316–337. [DOI] [PubMed] [Google Scholar]
- Basilakos A, Rorden C, Bonilha L, Moser D, Fridriksson J, 2015. Patterns of post-stroke brain damage that predict speech production errors in apraxia of speech and aphasia dissociate. Stroke 46 (6), 1561–1566. [DOI] [PMC free article] [PubMed] [Google Scholar]
- Bates DM, Maechler M, Bolker B, Walker S, 2016. Ime4: Linear Mixed-Effects Models using “Eigen” and S4 (Version R package version 1.1-12). Retrieved from <https://github.com/lme4/lme4/> <http://lme4.r-forge.r-project.org/>.
- Bohland JW, Bullock D, Guenther FH, 2010. Neural representations and mechanisms for the performance of simple speech sequences. J. Cogn. Neurosci 22 (7), 1504–1529. [DOI] [PMC free article] [PubMed] [Google Scholar]
- Caplan D, Waters GS, 1995. On the nature of the phonological output planning processes involved in verbal rehearsal: evidence from aphasia. Brain Lang 48 (2), 191–220. [DOI] [PubMed] [Google Scholar]
- Chertkow H, Bub D, 1990. Semantic memory loss in dementia of Alzheimer’s type: what do various measures measure? Brain 113 (2), 397–417. [DOI] [PubMed] [Google Scholar]
- Civier O, Bullock D, Max L, Guenther FH, 2013. Computational modeling of stuttering caused by impairments in a basal ganglia thalamo-cortical circuit involved in syllable selection and initiation. Brain Lang 126 (3), 263–278. [DOI] [PMC free article] [PubMed] [Google Scholar]
- Clark HM, Duffy JR, Strand EA, Josephs KA, 2016. Revision of the Apraxia of Speech Rating Scale. Presented at the Motor Speech Conference, Newport Beach, CA. [Google Scholar]
- Crawford JR, Garthwaite PH, Porter S, 2010. Point and interval estimates of effect sizes for the case-controls design in neuropsychology: rationale, methods, implementations, and proposed reporting standards. Cogn. Neuropsychol 27 (3), 245–260. [DOI] [PubMed] [Google Scholar]
- Dabul B, 2000. Apraxia Battery for Adults: Examiner’s Manual. Austin, TX: Pro-ed. [Google Scholar]
- Davis CJ, 2005. N-Watch: a program for deriving neighborhood size and other psycholinguistic statistics. Behav. Res. Methods 37 (1), 65–70. [DOI] [PubMed] [Google Scholar]
- DeDe G, Ricca M, Knilans J, Trubl B, 2014. Construct validity and reliability of working memory tasks for people with aphasia. Aphasiology 28 (6), 692–712. [Google Scholar]
- Deger K, Ziegler W, 2002. Speech motor programming in apraxia of speech. J. Phon 30 (3), 321–335. [Google Scholar]
- Dell GS, 1986. A spreading-activation theory of retrieval in sentence production. Psychol. Rev 93 (3), 283–321. [PubMed] [Google Scholar]
- Duffy JR, 2005. Motor Speech Disorders: Substrates. Differential Diagnosis, and Management. Elsevier Mosby, St Louis, MO. [Google Scholar]
- Folstein M, Folstein SE, McHugh PR, 1975. “Mini-mental state” a practical method for grading the cognitive state of patients for the clinician. J. Psychiatr. Res 12 (3), 189–198. [DOI] [PubMed] [Google Scholar]
- Gelman A, Hill J, 2007. Data Analysis Using Regression and Multilevelhierarchical Models 1 Cambridge University Press, New York, NY. [Google Scholar]
- Graff-Radford J, Jones DT, Strand EA, Rabinstein AA, Duffy JR, Josephs KA, 2014. The neuroanatomy of pure apraxia of speech in stroke. Brain Lang 129, 43–46. [DOI] [PMC free article] [PubMed] [Google Scholar]
- Guenther FH, 2016. Neural Control of Speech. MIT Press, Cambridge, MA. [Google Scholar]
- Guenther FH, Ghosh SS, Tourville JA, 2006. Neural modeling and imaging of the cortical interactions underlying syllable production. Brain Lang 96 (3), 280–301. [DOI] [PMC free article] [PubMed] [Google Scholar]
- Haley KL, Jacks A, de Riesthal M, Abou-Khalil R, Roth HL, 2012. Toward a quantitative basis for assessment and diagnosis of apraxia of speech. J. Speech Lang. Hear. Res 55 (5), S1502–S1517. [DOI] [PubMed] [Google Scholar]
- Hickok G, Rogalsky C, Chen R, Herskovits EH, Townsley S, Hillis AE, 2014. Partially overlapping sensorimotor networks underlie speech praxis and verbal short-term memory: evidence from apraxia of speech following acute stroke. Front. Hum. Neurosci 8. [DOI] [PMC free article] [PubMed] [Google Scholar]
- Hirsch P, Schwarzkopp T, Declerck M, Reese S, Koch I, 2016. Age-related differences in task switching and task preparation: exploring the role of task-set competition. Acta Psychol 170, 66–73. [DOI] [PubMed] [Google Scholar]
- Hula WD, McNeil MR, 2008. Models of attention and dual-task performance as explanatory constructs in aphasia. Semin. Speech Lang 29 (3), 169–187. [DOI] [PubMed] [Google Scholar]
- Jaeger TF, 2008. Categorical data analysis: away from ANOVAs (transformation or not) and towards logit mixed models. J. Mem. Lang 59 (4), 434–446. [DOI] [PMC free article] [PubMed] [Google Scholar]
- Jones HN, Kendall DL, Okun MS, Wu SS, Velozo C, Fernandez HH, Rosenbek JC, 2010. Speech motor program maintenance, but not switching, is enhanced by left-hemispheric deep brain stimulation in Parkinson’s disease. Int. J. Speech-Lang. Pathol 12 (5), 385–398. [DOI] [PubMed] [Google Scholar]
- Josephs KA, Duffy JR, Strand EA, Machulda MM, Senjem ML, Lowe VJ, Whitwell JL, 2013. Syndromes dominated by apraxia of speech show distinct characteristics from agrammatic PPA. Neurology 81 (4), 337–345. [DOI] [PMC free article] [PubMed] [Google Scholar]
- Kertesz A, 1982. Western Aphasia Battery. Grune & Stratton, New York, NY. [Google Scholar]
- Kuznetsova A, Brockhoff PB, Christensen RHB, 2016. lmerTest: Tests in Linear Mixed Effects Models (Version R package version 2.0-33). Retrieved from <http://cran.r-project.org/package=lmerTest/>. [Google Scholar]
- Levelt WJM, Roelofs A, Meyer AS, 1999. A theory of lexical access in speech production. Behav. Brain Sci 22 (1), 1–38. [DOI] [PubMed] [Google Scholar]
- Lukatela G, Turvey MT, 1994a. Visual lexical access is initially phonological: I. Evidence from associative priming by words, homophones, and pseudohomophones. J. Exp. Psychol.: Gen 123 (2), 107–128. [DOI] [PubMed] [Google Scholar]
- Lukatela G, Turvey MT, 1994b. Visual lexical access is initially phonological: 2. Evidence from phonological priming by homophones and pseudohomophones. J. Exp. Psychol.: Gen 123 (4), 331–353. [DOI] [PubMed] [Google Scholar]
- Maas E, Gutiérrez K, Ballard KJ, 2014. Phonological encoding in apraxia of speech and aphasia. Aphasiology 28 (1), 25–48. [DOI] [PMC free article] [PubMed] [Google Scholar]
- Maas E, Mailend M-L, 2012. Speech planning happens before speech execution: online reaction time methods in the study of apraxia of speech. J. Speech Lang. Hear. Res 55 (5), S1523–S1534. [DOI] [PubMed] [Google Scholar]
- Maas E, Mailend M-L, Guenther FH, 2015. Feedforward and feedback control in apraxia of speech: effects of noise masking on vowel production. J. Speech Lang. Hear. Res 58 (2), 185–200. [DOI] [PMC free article] [PubMed] [Google Scholar]
- Maas E, Robin DA, Wright DL, Ballard KJ, 2008. Motor programming in apraxia of speech. Brain Lang 106 (2), 107–118. [DOI] [PubMed] [Google Scholar]
- Mailend M-L, Maas E, 2013. Speech motor programming in apraxia of speech: evidence from a delayed picture-word interference task. Am. J. Speech-Lang. Pathol 22 (2), S380–S396. [DOI] [PubMed] [Google Scholar]
- Mayer JF, Murray LL, 2012. Measuring working memory deficits in aphasia. J. Commun. Disord 45 (5), 325–339. [DOI] [PubMed] [Google Scholar]
- McNeil MR, Ballard KJ, Duffy JR, Wambaugh JL, 2016. Apraxia of speech: theory, assessment, differential diagnosis and treatment: past, present and future In: van Lieshout P, Maassen B, Terband H (Eds.), Speech Motor Control in Normal and Disordered Speech: Future Developments in Theory and Methodology. ASHA Press, Rockville, MD, pp. 195–221. [Google Scholar]
- McNeil MR, Robin D, Schmidt R, 2009. Apraxia of speech: definition, differentiation, and treatment In: McNeil MR (Ed.), Clinical Management of Sensorimotor Speech Disorders. Thieme, New; York, NY, pp. 249–268. [Google Scholar]
- Meyer DE, Gordon PC, 1985. Speech production: motor programming of phonetic features. J. Mem. Lang 24 (1), 3–26. [Google Scholar]
- Milenkovic P, 2010. TF32: time frequency analysis software program. Retrieved from <http://userpages.chorus.net/cspeech/>.
- Minkina I, Rosenberg S, Kalinyak-Fliszar M, Martin N, 2017. Short-term memory and aphasia: from theory to treatment. Semin. Speech Lang 38 (1), 017–028. [DOI] [PMC free article] [PubMed] [Google Scholar]
- Perkell JS, 2012. Movement goals and feedback and feedforward control mechanisms in speech production. J. Neurolinguist. 25 (5), 382–407. [DOI] [PMC free article] [PubMed] [Google Scholar]
- R Core Team, 2016. R: A Language and Environment for Statistical Computing. R Foundation for Statistical Computing, Vienna, Austria: Retrieved from ⟨http://www.r-project.org/⟩. [Google Scholar]
- Rochon E, Caplan D, Waters G, 1990. Short-term memory processes in patients with apraxia of speech: implications for the nature and structure of the auditory verbal short-term memory system. J. Neurolinguist. 5 (2-3), 237–264. [Google Scholar]
- Rogers MA, Redmond JJ, Alarcon NB, 1999. Parameters of semantic and phonologic activation in speakers with aphasia with and without apraxia of speech. Aphasiology 13 (9-11), 871–886. [Google Scholar]
- Rogers MA, Storkel HL, 1998. Reprogramming phonologically similar utterances: the role of phonetic features in pre-motor encoding. J. Speech Lang. Hear. Res 41 (2), 258–274. [DOI] [PubMed] [Google Scholar]
- Rogers MA, Storkel HL, 1999. Planning speech one syllable at a time: the reduced buffer capacity hypothesis in apraxia of speech. Aphasiology 13 (9-11), 793–805. [Google Scholar]
- Rosenbaum DA, Kornblum S, 1982. A priming method for investigating the selection of motor responses. Acta Psychol 51 (3), 223–243. [Google Scholar]
- Salthouse TA, Hedden T, 2002. Interpreting reaction time measures in between-group comparisons. J. Clin. Exp. Neuropsychol 24 (7), 858–872. [DOI] [PubMed] [Google Scholar]
- Schwartz MF, Dell GS, Martin N, Gahl S, Sobel P, 2006. A case-series test of the interactive two-step model of lexical access: evidence from picture naming. J. Mem. Lang 54 (2), 228–264. [DOI] [PMC free article] [PubMed] [Google Scholar]
- Shallice T, 1988. Specialisation within the semantic system. Cogn. Neuropsychol 5 (1), 133–142. [Google Scholar]
- Shrout PE, Fleiss JL, 1979. Intraclass correlations: uses in assessing rater reliability. Psychol. Bull 86 (2), 420–428. [DOI] [PubMed] [Google Scholar]
- Spencer KA, Rogers MA, 2005. Speech motor programming in hypokinetic and ataxic dysarthria. Brain Lang 94 (3), 347–366. [DOI] [PubMed] [Google Scholar]
- Spencer KA, Wiley E, 2008. Response priming patterns differ with interstimulus interval duration. Clin. Linguist. Phon 22 (6), 475–490. [DOI] [PubMed] [Google Scholar]
- Strand EA, Duffy JR, Clark HM, Josephs K, 2014. The apraxia of speech rating scale: a tool for diagnosis and description of apraxia of speech. J. Commun. Disord 51, 43–50. [DOI] [PMC free article] [PubMed] [Google Scholar]
- Varley R, Whiteside SP, 2001. What is the underlying impairment in acquired apraxia of speech. Aphasiology 15 (1), 39–49. [Google Scholar]
- Vergis MK, Ballard KJ, Duffy JR, McNeil MR, Scholl D, Layfield C, 2014. An acoustic measure of lexical stress differentiates aphasia and aphasia plus apraxia of speech after stroke. Aphasiology 28 (5), 554–575. [Google Scholar]
- Wambaugh JL, Duffy JR, McNeil MR, Robin DA, Rogers MA, 2006. Treatment guidelines for acquired apraxia of speech: a synthesis and evaluation of the evidence. J. Med. Speech-Lang. Pathol 14 (2) (xv–xv). [Google Scholar]
- Wambaugh JL, Martinez AL, McNeil MR, Rogers MA, 1999. Sound production treatment for apraxia of speech: overgeneralization and maintenance effects. Aphasiology 13 (9-11), 821–837. [Google Scholar]
- Waters GS, Rochon E, Caplan D, 1992. The role of high-level speech planning in rehearsal: evidence from patients with apraxia of speech. J. Mem. Lang 31 (1), 54–73. [Google Scholar]
- Yaniv I, Meyer DE, Gordon PC, Huff CA, Sevald CA, 1990. Vowel similarity, connectionist models, and syllable structure in motor programming of speech. J. Mem. Lang 29 (1), 1–26. [Google Scholar]
- Ziegler W, 2002. Psycholinguistic and motor theories of apraxia of speech. Semin. Speech Lang 23 (4), 231–244. [DOI] [PubMed] [Google Scholar]
- Ziegler W, 2005. A nonlinear model of word length effects in apraxia of speech. Cogn. Neuropsychol 22 (5), 603–623. [DOI] [PubMed] [Google Scholar]
- Ziegler W, 2008. Apraxia of speech In: Handbook of Clinical Neurology, pp. 269–285. [DOI] [PubMed] [Google Scholar]
- Ziegler W, 2009. Modelling the architecture of phonetic plans: evidence from apraxia of speech. Lang. Cogn. Process 24 (5), 631–661. [Google Scholar]