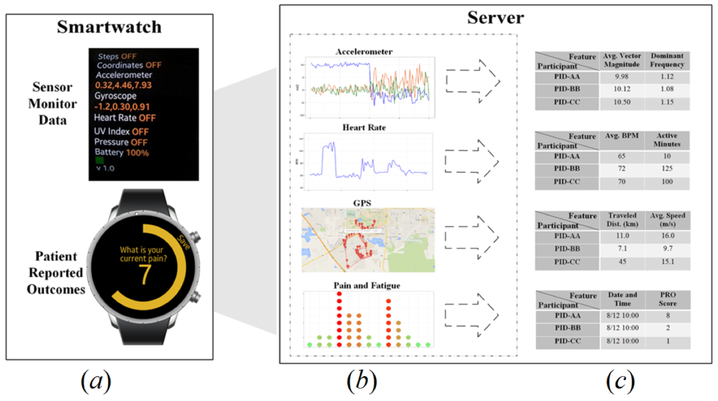
Figure 8:
ROAMM framework data flow. Sensor monitor and patient-reported data are collected and transmitted to the server by the ROAMM application. (a) shows the ROAMM smartwatch application user interface. (b) shows the visualization of the data on the server. The administrative web portal facilitates filtering and retrieving the collected data. Data are transferred to the server, where they are stored in a high-performance fault-tolerant database. Data can be viewed or run through any custom analysis pipeline for presentation and/or analysis. (c) depicts how data are processed into variables for analysis. Depending on the study, a variety of variables can be constructed from the data, either on the smartwatch or later on the server.

