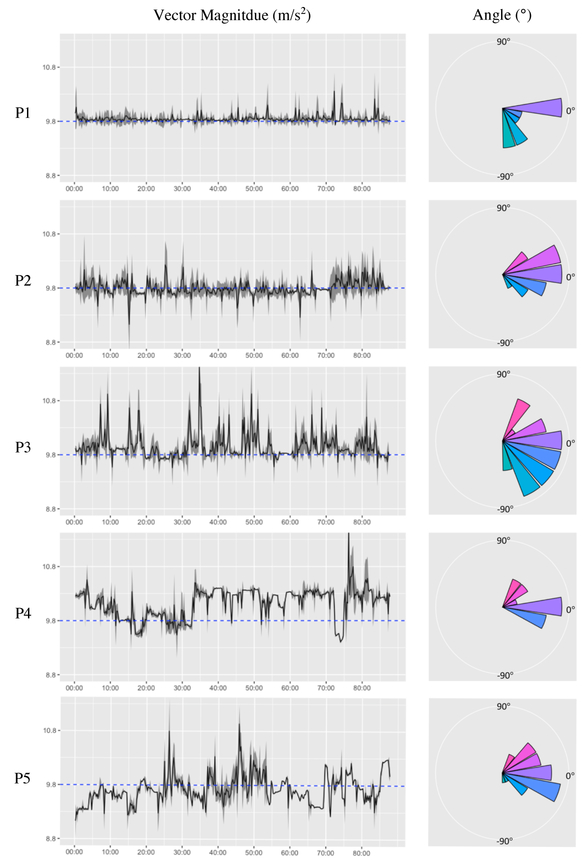
Figure 9:
Visualization of 350 data points (87.5 minutes) of accelerometer sensor data for 5 participants. The time-series plots (left) show the average vector magnitude (MVM) over every 15 seconds. For each point, one standard deviation is also shown as the shaded area. The constant gravity force (≈ 9.8 m/s2) is displayed as blue dashed line. On the right, the existing angle between the forearm and the horizontal line (MANGLE) is displayed for the same time periods. Each bar shows the frequency of an angle (±10°). For example, for the first participant, we observe that the hand is placed on a horizontal surface (e.g., when working with a computer) or resting by participant’s side (e.g., natural position of hand when standing) for most of the times.

