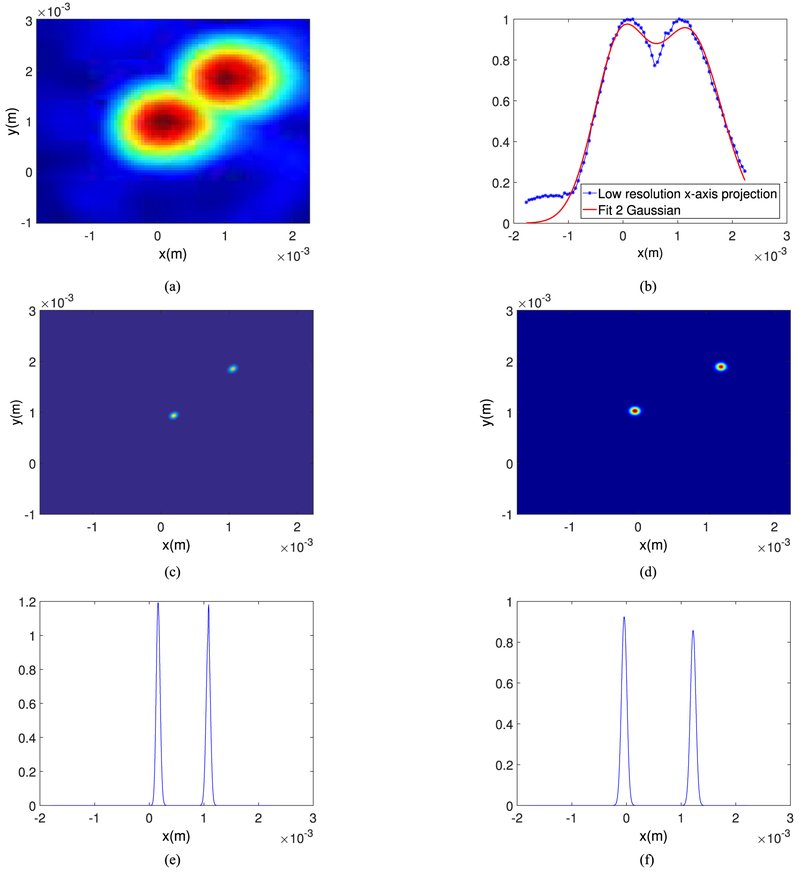
Fig. 10.
Images of two bubbles separated laterally 1 mm (a) 2D lateral image, (b) Two Gaussian curves fitting of (a), solid line shows the fitted curve and the dots show the intensity projection along the x-axis, (c) Super-resolution image using deconvolution method plotted on an eight fold upsampled grid, (d) Super-resolution image using curve fitting method plotted on an eight fold upsampled grid (e) Projection of (c) along the x-axis (f) Projection of (d) along the x-axis.

