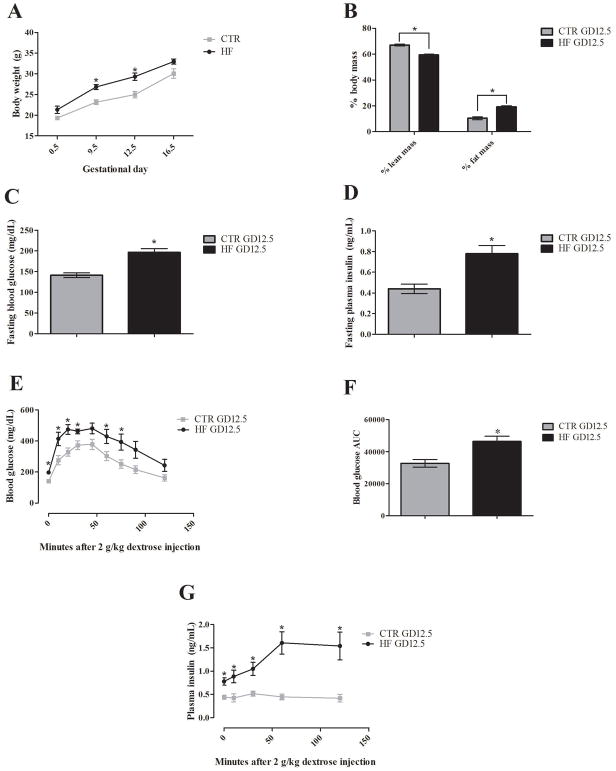
Figure 1. High fat diet produces a diabetic phenotype midgestation.
Body composition, 6 hour fasting glucose and insulin, and glucose tolerance measurements were performed on a cohort of high fat and control fed GD12.5 pregnant dams (n=6 per group, HF and CTR in graph, respectively). (A) High fat fed dams showed significant increases in body weight at GD9.5 and GD12.5. (B) Whole body NMR at GD12.5 showed significant changes in % body mass in high fat dams with increased % fat mass and decreased % lean body mass. (C–D) 6 hour fasting blood glucose and serum insulin were both significantly increased in high fat dams. (E–G) After a 6 hour fast, dams were injected intraperitoneally with 2 g dextrose/kg body weight. High fat fed dams demonstrated a higher peak and prolonged increase in blood glucose with significant differences from control dams observable at 0 10, 20, 30, 60, and 75 minutes post-injection, which is supported by a significantly increased area under the curve. A significant heightened insulin response that was maintained up until the 2 hour end point was also observed in high fat dams. Error bars represent SEM. Significance determined by unpaired student t-test with Welch’s correction in all assays. (* = p <0.05, n=6 dams per group)

