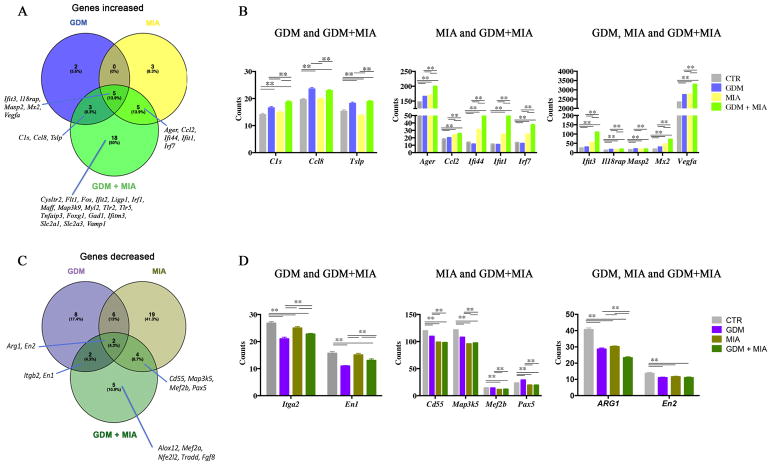
Figure 4. GDM and MIA alter expression of neurodevelopmental and inflammatory genes at GD12.5.
Venn diagrams denote the number of genes increased (A) or decreased (B) in GDM, MIA, or GDM+MIA when compared to control mice. The graphics represent gene counts increased (C) or decreased (D) in GDM and GDM+MIA, MIA and GDM+MIA or GDM, MIA and GDM+MIA as indicated. (A and B) Significant changes in gene expression were determined by multiple t tests, and genes with p<0.05, FDR<0.01 were selected. (C and D) Tukey’s multiple comparisons 2way ANOVA was used to determine significance among the groups. Gene symbols are listed according to HUGO Gene Nomenclature Committee 75.

