Fig. 5.

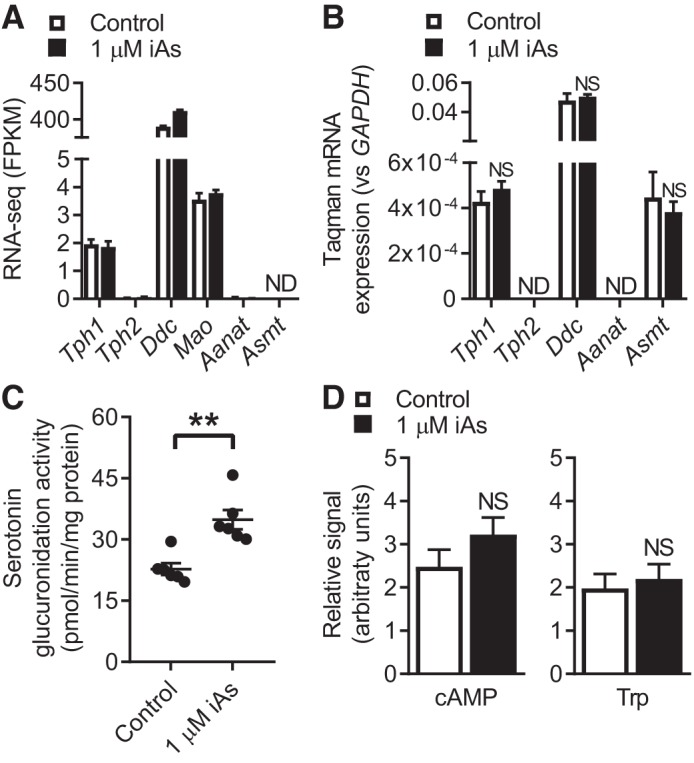
Serotonin metabolism characteristics. A and B: RNA sequencing (RNA-seq) (A) or Taqman (B) expression values for genes related to serotonin metabolism. C: the rate of serotonin glucuronidation in MIN6-K8 lysates following 3 days of inorganic arsenite (iAs) exposure, normalized to total protein. This assay is described in more detail in materials and methods. (n = 6). D: cyclic AMP (cAMP) and tryptophan (Trp) content quantified by metabolomics as described previously (n = 11). NS, not significant; ND, not detected. A: RNA-seq was performed on samples collected during 1 experiment. B: 3 independent experiments. C and D: 2 independent experiments. Statistics: A: RNA-seq data were analyzed as described in materials and methods. B and C: Student’s t-test. D: analysis detailed in materials and methods. **P < 0.01.
