Fig. 5.
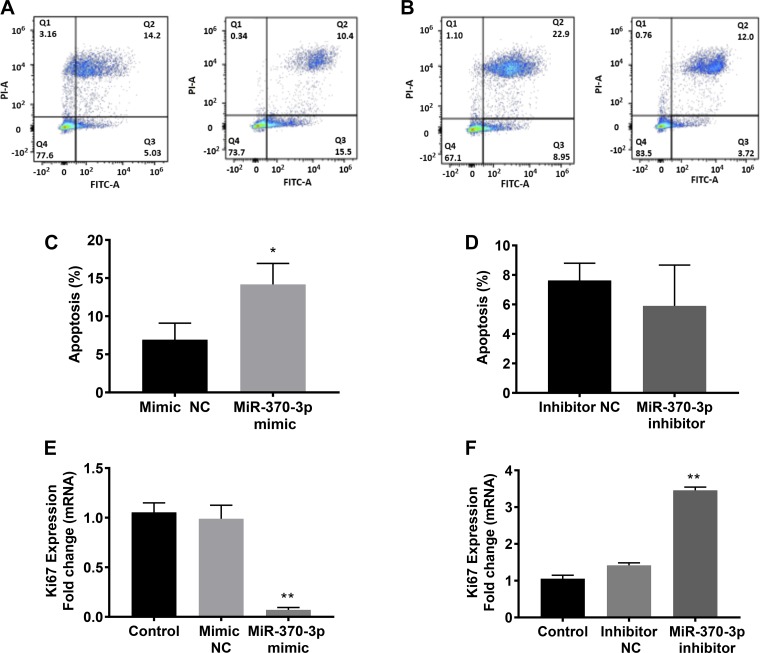
miR-370-3p induced apoptosis determined by flowcytometric analysis. A and B: histograms of FACS analysis of cells transfected with of miR-370-3p mimic (A) and inhibitor (B). The percentage of apoptosis was shown in the bar graphs below. C: number of apoptotic cells increased significantly in cells in which the miR-370-3p mimic was overexpressed compared with controls. Bars represent the means ± SE for data from 3 individual experiments. *P < 0.05, statistical significance compared with the negative controls. D: no significant changes in the number of apoptotic cells between cells in which miR-370-3p was inhibited compared with the negative control. E and F: overexpression of miR-370-3p mimic inhibited cell proliferation showing the decreased mRNA levels of Ki67 (E) while shows the increased Ki67 mRNA levels (F) in ECSCs in which miR-370-3p inhibitor is overexpressed compared with the control cells that are not treated either with mimic or inhibitor. Each bar represents the means ± SE for data from 3 individual experiments, and each experiment was performed in duplicate. *P < 0.05, statistical significance compared with controls. **P < 0.01, statistical significance compared with controls.

