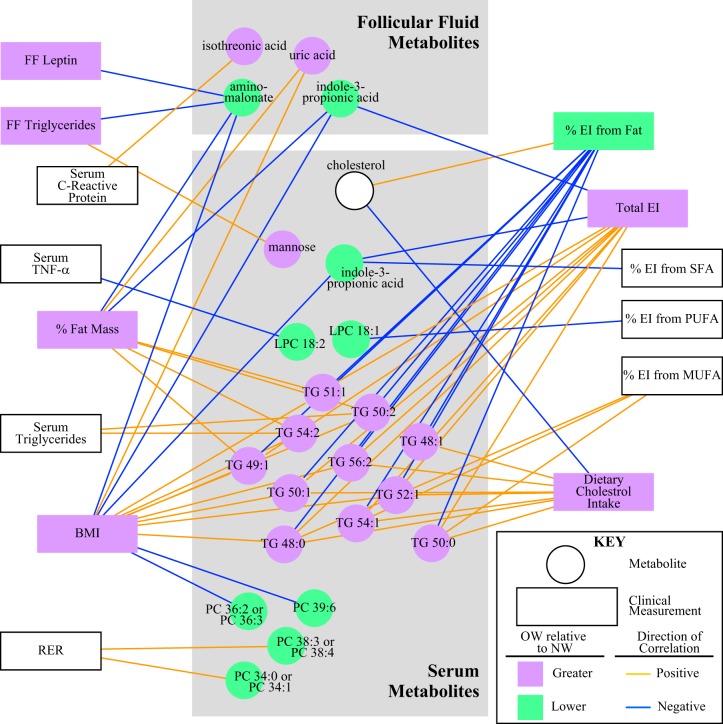
Fig. 6.
Network analysis display of metabolites that were identified by partial least squares-discriminant analysis modeling within both body mass index (BMI) and body fat (BF) analyses for both serum and follicular fluid separated into 2 gray boxes. Square nodes depict different clinical variables, and circular nodes are featured metabolites. Nodes in green indicate that metabolites or clinical variables are significantly lower in overweight/obese (OW) relative to normal weight (NW) women, and purple indicates significantly higher in OW relative to NW women. This analysis correlated all the metabolites and clinical variables with Spearman’s correlations filtered by P < 0.01. The directions of the correlations are depicted in yellow to show positive correlations and in blue to show negative correlations between metabolites and clinical variables. Only complete data were used for this analyses, so any sample with missing data was dropped from this analysis, resulting in disparate outcomes for serum C-reactive protein [i.e., serum C-reactive protein was statistically significant when comparing BMI in all women (Table 3) but was not statistically significant in the correlation network]. EI, energy intake; LPC, lysophosphatidylcholine; MUFA, monounsaturated fatty acid; PC, phosphatidylcholine; PUFA, polyunsaturated fatty acids; SFA, saturated fat; TG, triglyceride; RER, respiratory exchange ratio.

