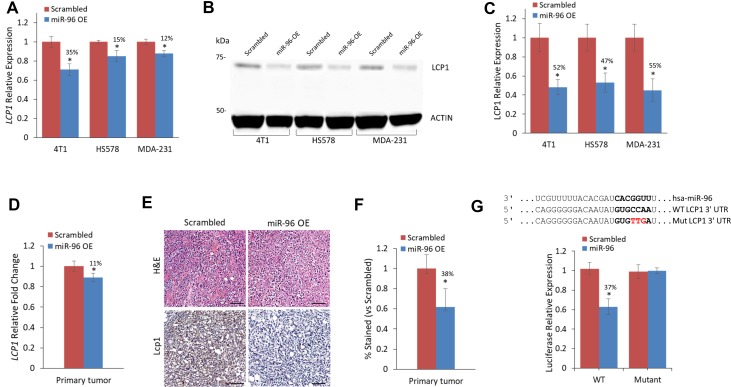
Figure 2. LCP1 gene and protein expression are reduced in direct response to miR-96 overexpression.
(A) LCP1 expression levels in 4T1, HS578, and MDA-231 cell lines expressing miR-96 OE or scrambled control. LCP1 expression is reduced in all cell lines with miR-96 OE. (B) Western blot of LCP1 in breast cancer cell lines and (C) calculated LCP1 protein expression in cell lines with miR-96 OE or scrambled control. In all cell lines, LCP1 expression is twofold decreased in miR-96 OE cells compared to scrambled control. (D) LCP1 in primary tumors of mice injected with miR-96 overexpressing or scrambled control 4T1 cells. LCP1 and miR-96 expression levels are inversely correlated (E) H&E and immunohistochemistry for Lcp1 of resected murine primary breast tumors. Scale bars represent 50 µm (F) Calculated difference in Lcp1 immunohistochemical staining between miR-96 OE or scrambled control. Reduced Lcp1 staining is seen in miR-96 OE compared to Scrambled. (G) Luciferase binding assay for miR-96 and Lcp1. Predicted binding site (indicated by bold letters) for hsa-miR-96 on the LCP1 3′-UTR. Wild type (WT) and mutant (Mut) miR-96 binding sites are presented. Red nucleotides represent the three mutated nucleotides in the miR-96 seed binding site. Luciferase activity 24 h following co-transfection of HeLa cells with hsa-miR-96 and LCP1 WT or Mut 3′-UTR construct. Significant decrease in Luciferase activity was seen when transfected with LCP1 WT but not with 3′-UTR Mut. Data are presented as mean ± SEM. *p < 0.05, **p < 0.01.

