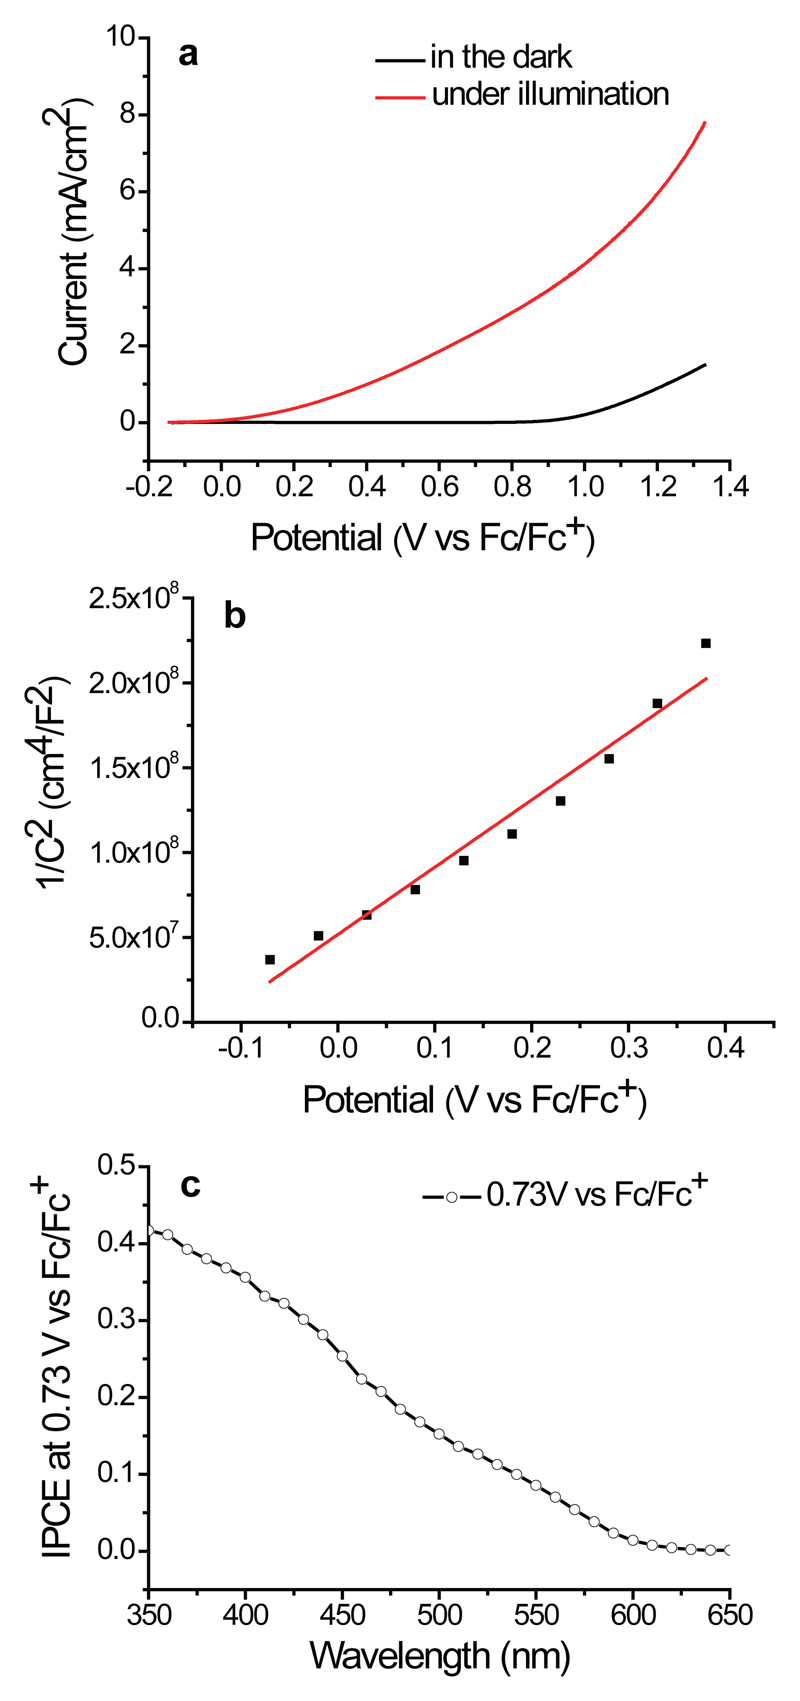
Figure 4. (Photo)electrochemical measurements.
a. LSV curves of a hematite photoelectrode under LED illumination (red line) and in the dark (black line) in HFIP/MeOH (4:1, 3 mL) containing LiClO4 (0.1 M), anisole (0.2 mmol) and pyrazole (0.4 mmol). Scan rate: 30 mV/s; b. Mott-Schottky plot measured in HFIP/MeOH (4:1); c. IPCE of hematite measured under catalytic conditions at E = 0.73 V vs Fc/Fc+.

