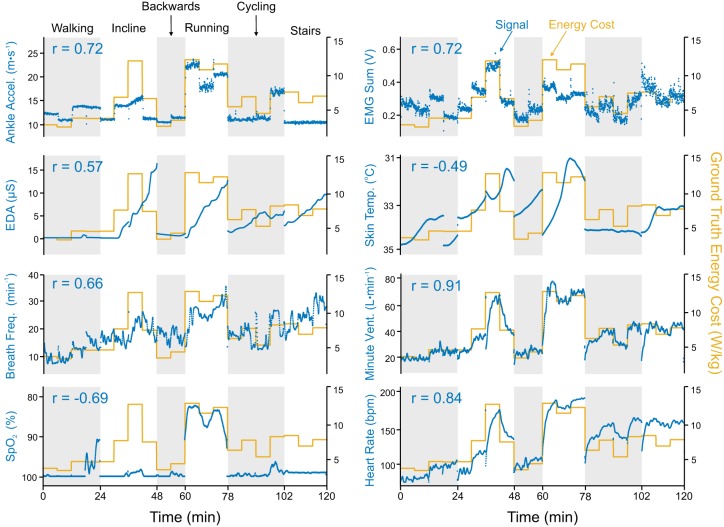
Fig. 2.
Time series plots for 8 filtered signals from 1 representative subject (subject 4) for all 6 physical activities. Depicted ankle acceleration, electromyography (EMG) sum, electrodermal activity (EDA), and skin temperature are taken from the left side of the body. Left axes measure the physiological signal (blue); right axes measure ground truth energy cost (yellow). Pearson’s correlation coefficient (r) between the signal and ground truth energy cost is written at the top left of each graph. For those signals with negative correlations [blood oxygen saturation () and skin temperature], the left axis is reversed (i.e., smaller values are at the top) to allow for visual overlay.

