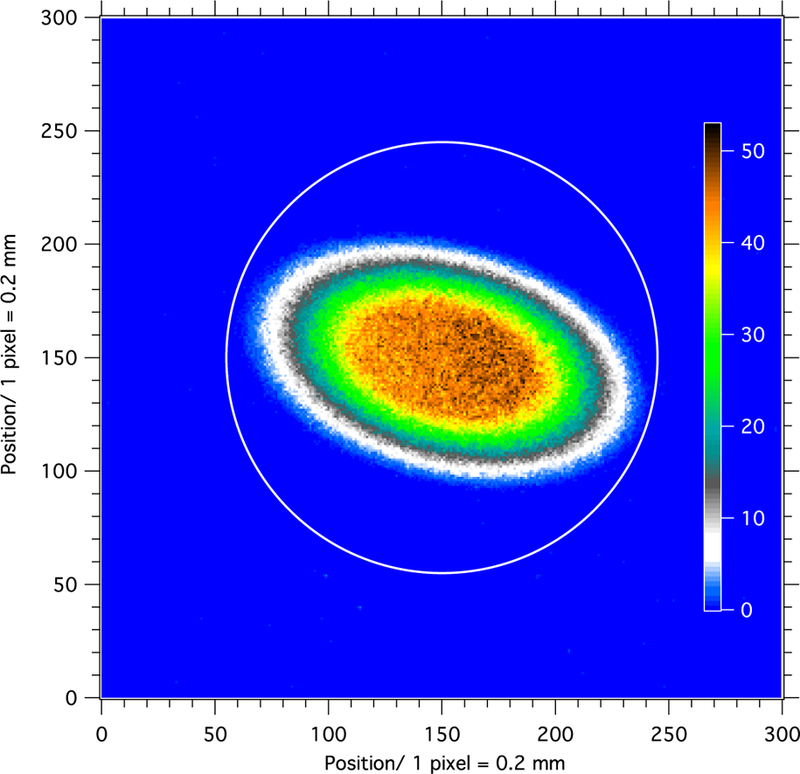
Figure 14.

Beam images were acquired at the alpha–gamma deposit location with C1 = 15 mm and C2 = 7.2, 8.38, and 10.5 mm. The image for the largest collimation of C2 = 10.5 mm is shown here; the color scale represents linear intensity, and the image orientation is arbitrary. The white circle corresponds to the edge of the active area of the thin 10B deposit.
