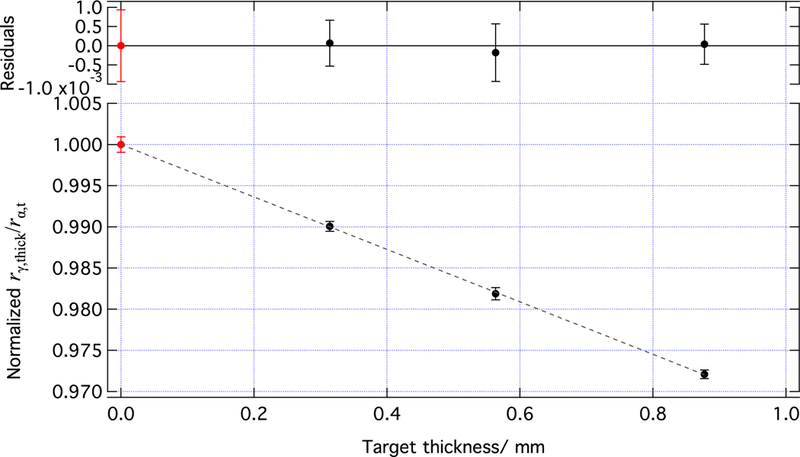
Figure 18.

A plot of the ratio for three thicknesses of B4C: 0.321 mm, 0.571 mm, and 0.892 mm. The black points are measured values, and the point for the largest thickness is the sum of the first two. The dashed line is a linear fit to those three data points, and the residuals are shown in the upper plot. The red point is the result of the fit at 0 thickness, and the y-axis was normalized to make that point be 1. This was done to make the magnitude of the correction factor obvious. The error bars represent statistical uncertainty only.
