
Fig. 2.
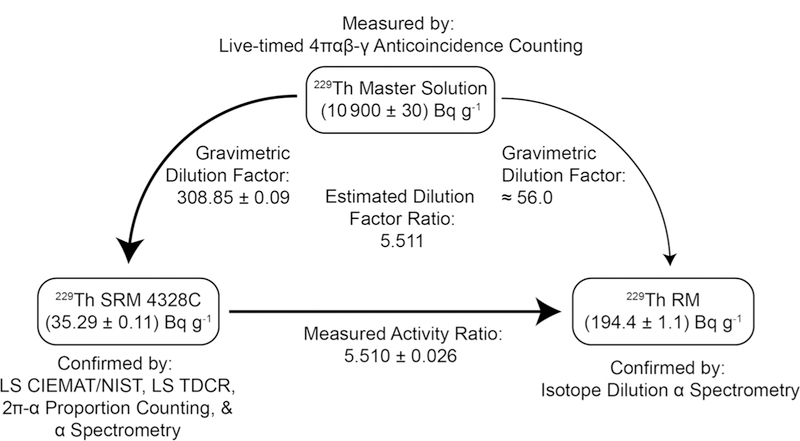
Schematic of material and analytical linkages between the M solution, SRM 4328C, and the 229Th RM. Bold arrows indicate the activity measurement linkages. The lighter arrow indicates direct production of the 229Th RM from the M solution. Activity values shown in the figure are for the December 31, 2007 reference date of the massic activity value of the M solution. All uncertainties are combined standard uncertainties