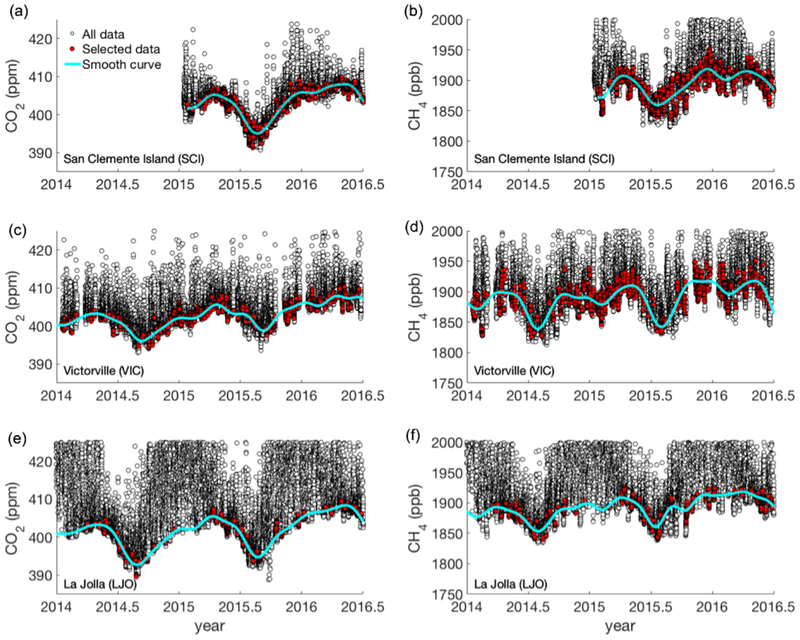
Figure 3.
Time series of 1 h average observations from the San Clemente Island (SCI; a, b), Victorville (VIC; c, d), and La Jolla (LJO; e, f) sites between January 2014 and June 2016. Hourly average observations of CO2 (a, c, e) and CH4 (b, d, f) were filtered using stability criteria, as described in the text. The CCGCRV curve-fitting algorithm was then used to fit the selected data in an iterative approach by removing CO2 and CH4 outliers > ±2σ (see Supplement for further information on the fitting parameters). The final filtered data set (red points) and smooth curve fits (cyan lines) are also shown. Note: values outside of the range plotted are not shown.

