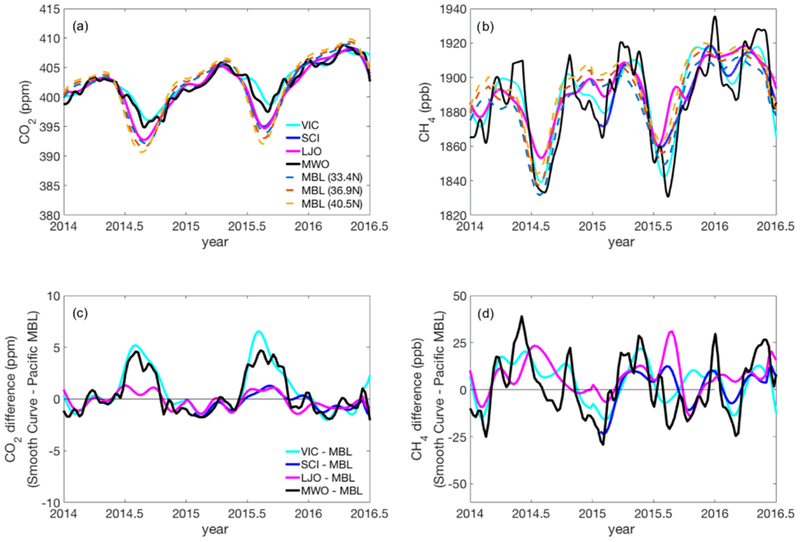
Figure 4.
Comparison of background estimates for Los Angeles for CO2 (a, c) and CH4 (b, d) at various sites from January 2014 to June 2016. (a–b) Smooth curve results for Victorville (VIC; cyan), San Clemente Island (SCI; blue), La Jolla (LJO; magenta), Mt. Wilson (MWO; black), and a 2-D Pacific marine boundary layer curtain estimate (MBL; light blue, red, and yellow dashed lines show results for at 33.4, 36.9, and 40.5° N, respectively). The SCI, VIC, and LJO curves were generated using data selected based on stability criteria. The MWO curve was generated using nighttime flask data collected every 3–4 days. (c–d) Background estimates from each site plotted as a difference from the MBL curtain at 33.4° N.

