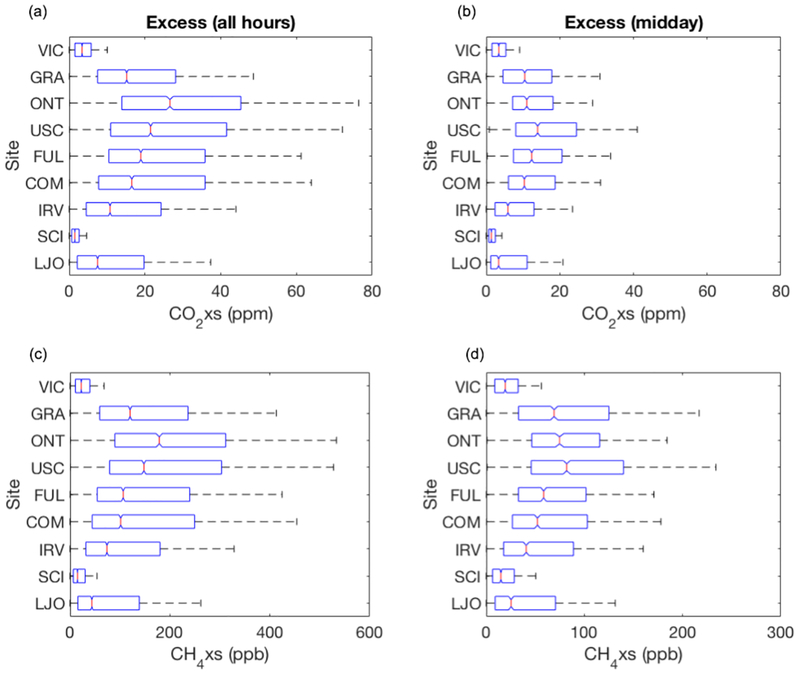
Figure 6.
Boxplot of enhancements (CO2xs and CH4xs) in the LA megacity observed during 2015 relative to the San Clemente Island background estimate. Results are shown for CO2xs (a, b) and CH4xs (c, d) and for all hours (a, c) and mid-afternoon hours (12:00–16:00 LT, b, d). The sites are arranged by latitude from north to south (top to bottom): Victorville (VIC), Granada Hills (GRA), Ontario (ONT), downtown LA (USC), California State University, Fullerton (FUL), Compton (COM), University of California, Irvine (IRV), San Clemente Island (SCI), and La Jolla (LJO). Boxes outline the 25th and 75th percentiles of the sample data, respectively, and red horizontal lines show the median values at each site. Values outside the 25th and 75th percentiles are not shown here but are plotted in Fig. S11. (Note: only positive enhancements are shown. Results for the ONT site are for September to December 2015, while all other results are annual averages. Results from the USC site are shown for the G2401 analyzer only).

