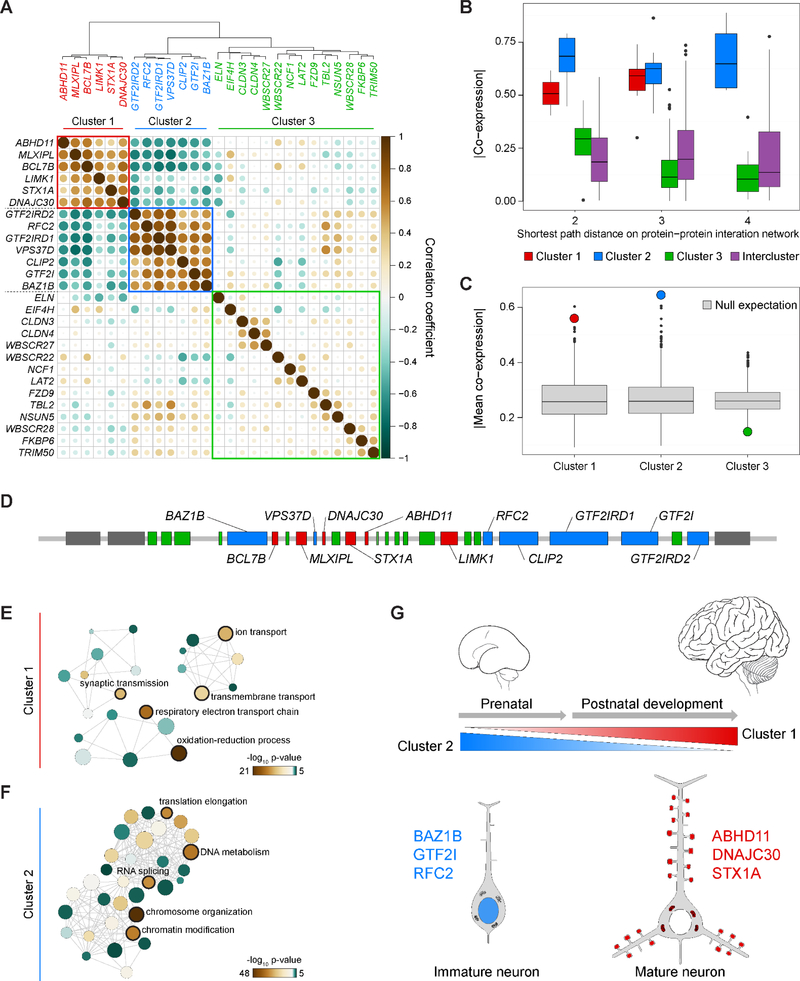
Figure 1. Top Functions of 7q11.23 Brain-Expressed Genes are Nuclear, Synaptic, and Mitochondrial.
(A) A dendrogram and heatmap of brain transcriptional similarities for all 7q11.23 genes highlights three clusters. (B) The co-expression of all genes in each cluster and their PPI network. Data are plotted as ±SEM and outliers as points. All of the cluster 1 proteins are connected by a distance of 3 on the PPI network. (C) The mean co-expression for clusters 1 and 2 are higher than predicted based on randomly selected genes having identical numbers of protein-protein interactors (null expectation). (D) Genes of the 7q11.23 locus are colored by cluster from part A, with gene names from clusters 1 and 2. (E-F) GO analysis of the top 1000 co-expressed genes for each gene in clusters 1 and 2, respectively. Larger nodes indicate higher term frequency. (G) Summary of Figure 1 and Supplementary Figure 1 showing the spatiotemporal contributions of cluster 1 and cluster 2 genes to neurodevelopmental processes. See also Tables S1–S4 and Figure S1.

