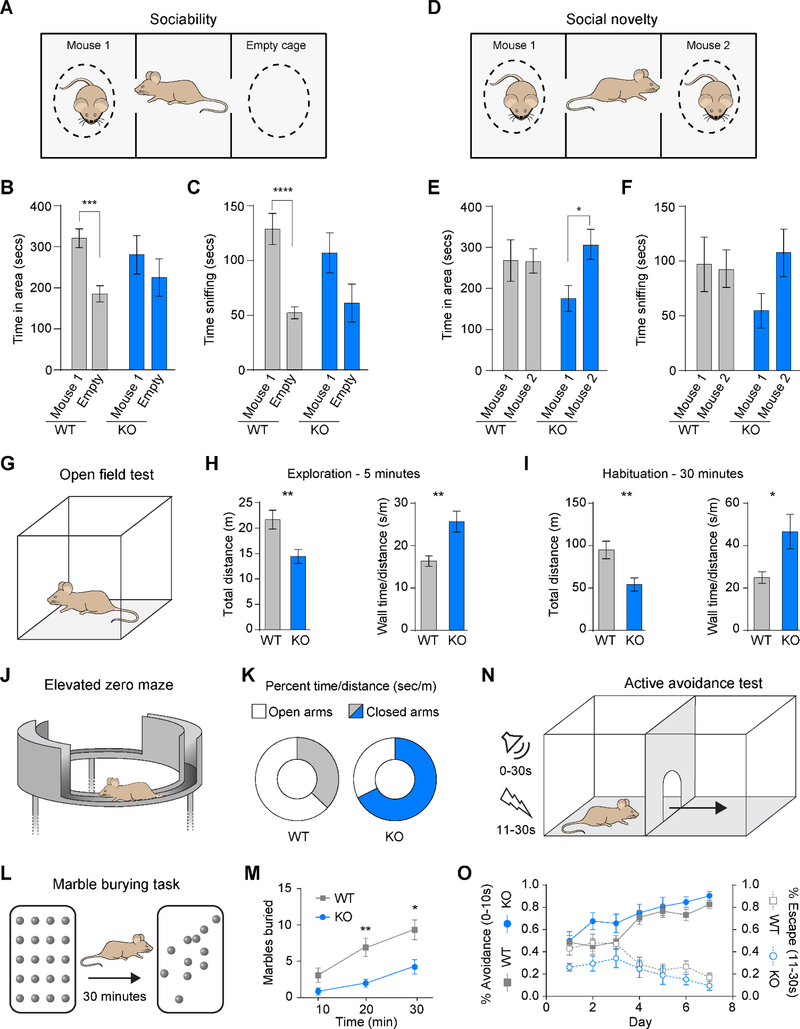
Figure 5. Dnajc30 Knockout Mice Exhibit Hypersociability and Increased Anxiety.
(A and D) Illustrations of sociability and social novelty tests, respectively. (B-C) Time spent in area and time spent sniffing, respectively, in the sociability test. (E-F) Time spent in area and time spent sniffing, respectively, in social novelty test (WT, n=11; KO, n=9). (G) Illustration of an open field test. (H) Distance traveled and time spent along the wall during the first 5 minutes of OFT. (I) Distance traveled and time spent along the wall during the total 30 minutes of OFT. (J-K) Illustration and results of elevated zero maze (WT, n=10; KO, n=7; popen=0.29; pclosed=0.25). (L-M) Illustration and results of the Marble burying task (WT, n=12; KO, n=8). (N-O) Illustration and results of the Active avoidance test (WT, n=12; KO, n=7). m, meters; min, minutes; s/sec, seconds. Statistical analyses were performed using student’s t-test with corrections using the Holm-Sidak method, and using repeated measures ANOVA. *, p<0.05; **, p<0.005; ***, p<0.0005; ****, p<0.0001. See also Figure S5 and S6.

