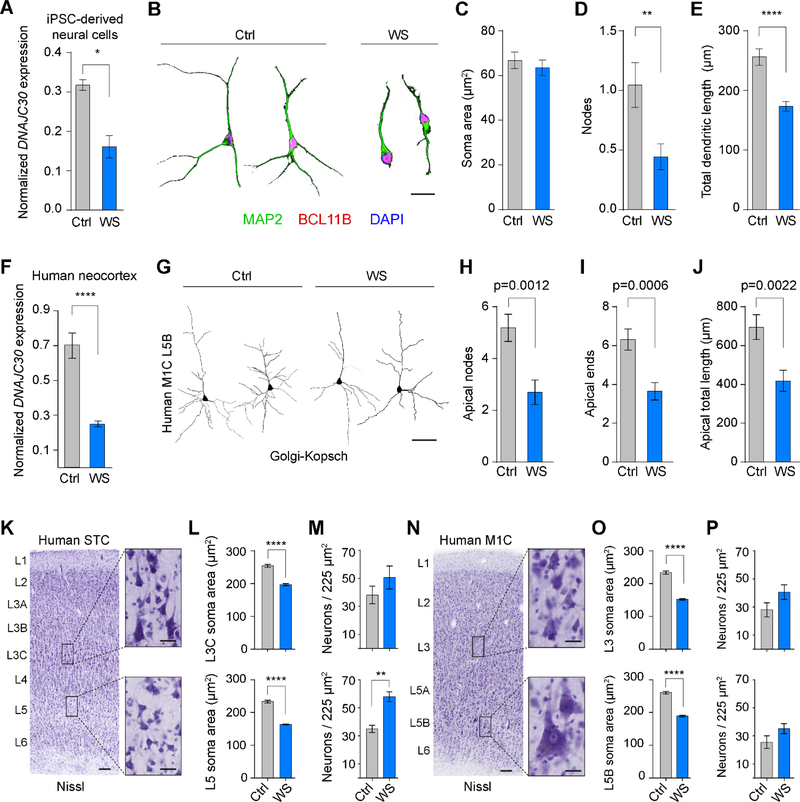
Figure 6. Neuronal Structural Deficits in Williams Syndrome Cells and Brains.
(A) ddPCR showing expression ratio of DNAJC30:TBP in human iPSC-derived neural cells (Ctrl, n=3; WS, n=4). (B) Representative iPSC-derived neurons immunofluorescently labeled for morphological analysis. Scale bar = 40um. (C-E) Quantification of soma area, nodes, and total dendritic length, respectively, of MAP2- and BCL11B-positive neurons. (F) Expression ratio (DNAJC30:TBP) in human NCX samples (n=3 for each genotype). (G) Representative images from Golgi-stained M1C deep layer neurons in Ctrl (n=3) and WS (n=3) NCX. Scale bar = 100um. (H-J) Quantification of neuronal apical architecture from Golgi-stained NCX (Ctrl, n=19 neurons/3 specimens; WS, n=22 neurons/3 specimens). (K) Nissl stain and regions of interest from human STC. Low magnification scale bar = 100um, high magnification insets = 20um. (L) Soma area from L3C and L5 Nissl-stained neurons (Ctrl L3, n=286 neurons/3 specimens; WS L3, n=298 neurons/3 specimens; Ctrl L5, n=301 neurons/3 specimens; WS L5, n=293 neurons/3 specimens). (M) Neuron density in L3C and L5 STC (Ctrl, n=2 areas each for 3 specimens; WS, n=2 areas each for 3 specimens). (N) Same as K, but for human M1C. (O) Soma area from L3 and L5B Nissl-stained neurons (Ctrl L3, n=185 neurons/3 specimens; WS L3, n=190 neurons/3 specimens; Ctrl L5, n=199 neurons/3 specimens; WS L5, n=200 neurons/3 specimens). (P) Neuron density in L3 and L5B M1C (Ctrl, n=2 areas each for 3 specimens; WS, n=2 areas each for 3 specimens). *, p<0.05; **, p<0.01; ****, p<0.0001 using a student’s t-test.

